
12 Essential Data Metrics for Social Media Operators in 2026
12 Essential Data Metrics for Social Media Operators in 2026
Summary: In an operations meeting, the director asks "How was last week's data?" and the team exchanges awkward glances. This article reviews the 12 essential data metrics for 2026 to help you speak with data.
An Awkward Operations Meeting
November 2025, Monday morning at 10 AM.
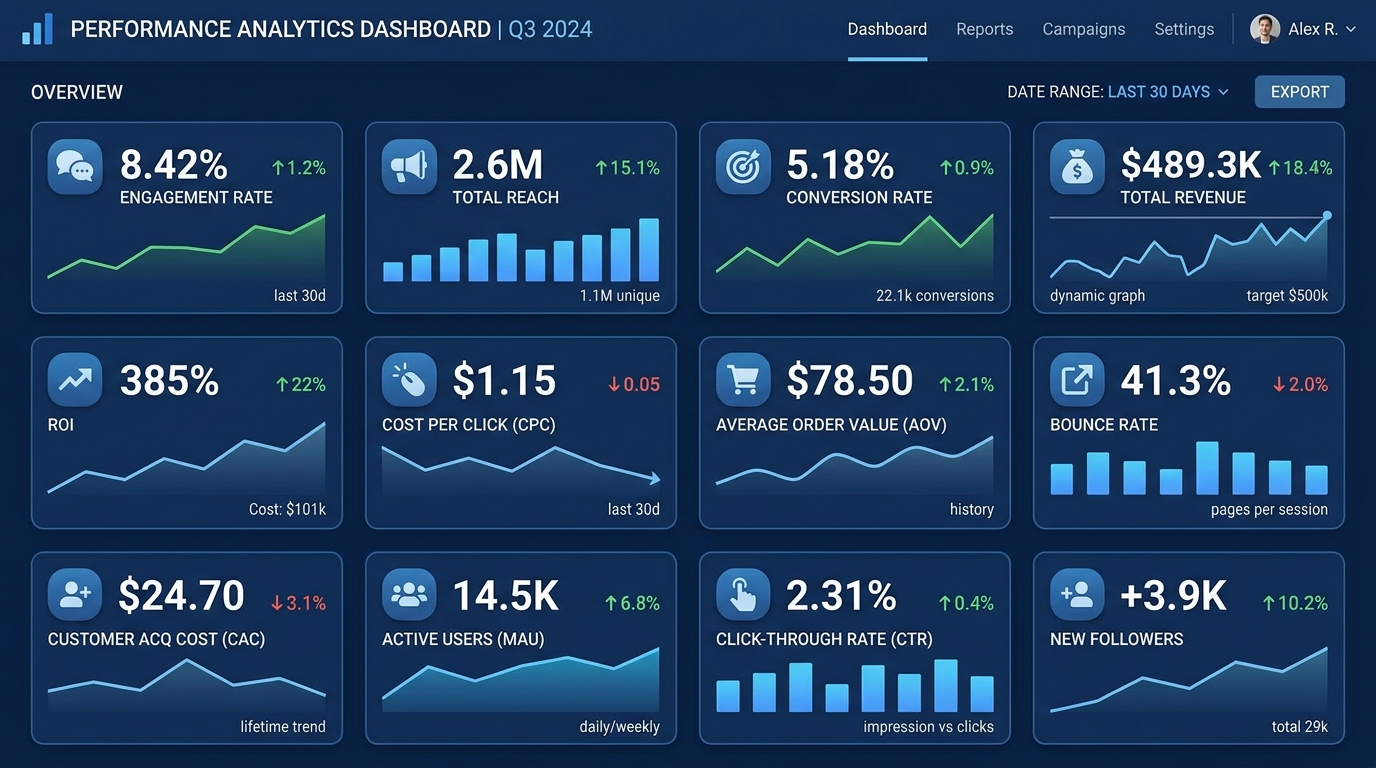
In the operations meeting room of a tech company, the atmosphere was awkward.
"How was last week's data?" asked Lao Zhang, the operations director.
The team exchanged glances.
Xiao Li, Instagram operations, said: "Instagram... pretty good, lots of likes."
"How many?" Lao Zhang asked.
"Uh... didn't count exactly, probably tens of thousands."
Xiao Wang, LinkedIn operations, said: "LinkedIn was also good, a few posts went viral."
"How many views? How many new followers?"
"I'll... check when I get back."
Xiao Zhao, TikTok operations, said: "TikTok traffic was good, one video got very high views."
"How high? What about conversion rate?"
"Conversion rate... didn't calculate."
Lao Zhang sighed.
"We're in operations," Lao Zhang said, "we can't go by feelings."
"Good is good, bad is bad."
"What the data says, that's what it is."
"Starting next week, I want to see specific data."
After the meeting, the team started organizing data.
But the question arose: what data to look at?
Each platform backend has dozens of metrics — which ones to watch?
Xiao Li asked Lao Zhang: "Mr. Zhang, what metrics should we actually be looking at?"
Lao Zhang thought for a moment and listed 12.
"These 12 metrics," Lao Zhang said, "are essential for social media operators in 2026."
"Every metric needs to be watched, needs to be analyzed."
"If you don't understand, go learn."
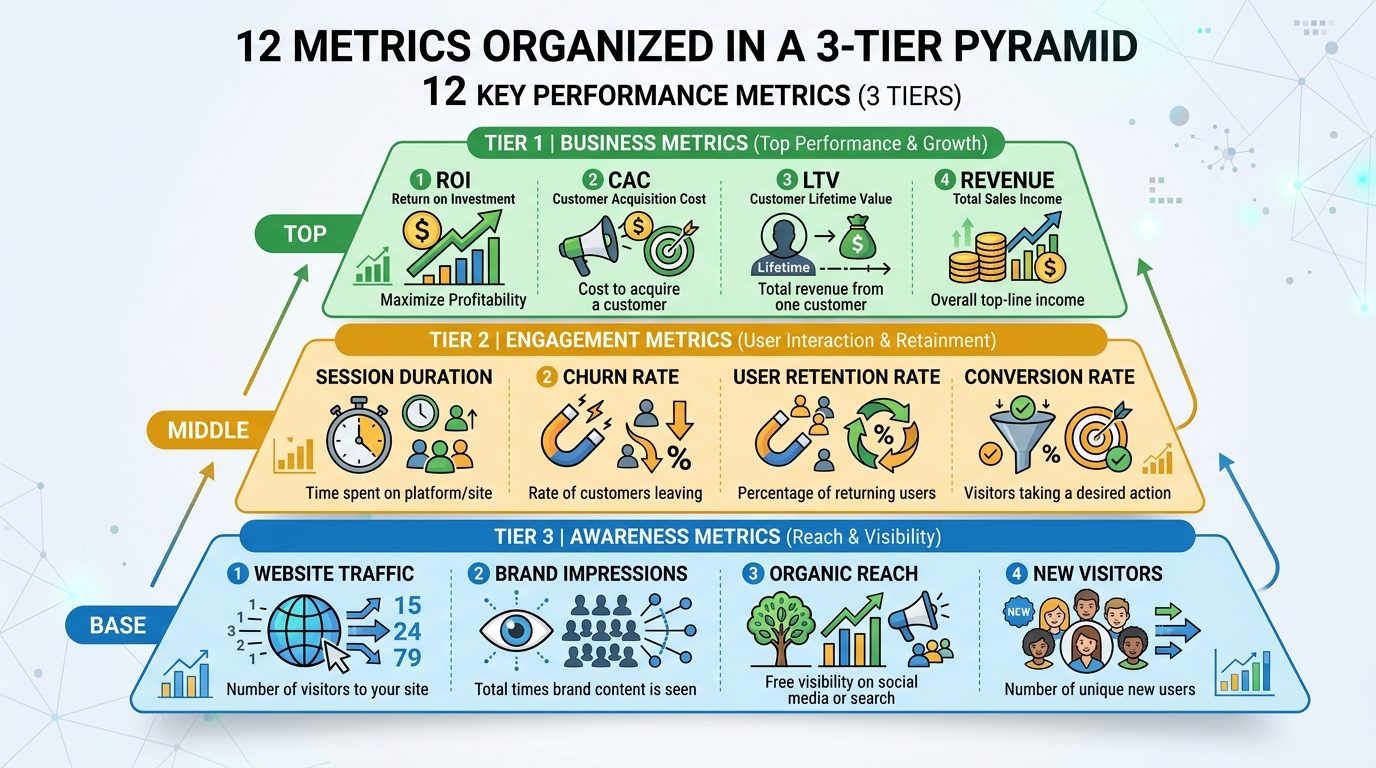
12 Essential Metrics, Divided into 4 Categories
Lao Zhang divided the 12 metrics into 4 categories.
Category 1: Reach Metrics (3)
Reach metrics measure how many people see your content.
1. Impressions
The number of times content is displayed.
When a user scrolls past your content, that counts as one impression.
High impressions mean the algorithm is recommending more, or you have a large follower base.
But impressions don't equal views — users might have scrolled past.
2. Views/Plays
The number of times users actually read or play your content.
This metric is more realistic than impressions.
Views / Impressions = Click-through rate, measuring content attractiveness.
3. Reach
The number of unique users who saw your content.
If one user sees it 10 times, impressions are 10, but reach is 1.
Reach measures coverage.
Category 2: Engagement Metrics (3)
Engagement metrics measure whether users are interested in your content.
4. Engagement Rate
(Likes + Comments + Shares + Saves) / Views.
This is the most important metric.
High engagement rate means good content quality — the algorithm will give you more traffic.
Low engagement rate means there's a problem with the content — needs optimization.
5. Comment Rate
Comments / Views.
Comment rate is more valuable than like rate.
Likes are shallow engagement, comments are deep engagement.
When users are willing to comment, it means the content triggered thought or resonance.
6. Share Rate
Shares / Views.
Share rate is a measure of virality.
When users are willing to share, it means the content has value and can help others.
Category 3: Growth Metrics (3)
Growth metrics measure whether your account is growing.
7. Net Follower Growth
New followers - Unfollowers.
Net follower growth is an indicator of account health.
Positive net growth means the account is growing.
Negative net growth means there's a problem with the account.
8. Follower Growth Rate
Net follower growth / Total followers.
This metric is more meaningful than absolute values.
An account with 10,000 followers gaining 1,000 has a 10% growth rate.
An account with 1 million followers gaining 1,000 has a 0.1% growth rate.
Which is better? Obviously the former.
9. Active Follower Ratio
Active followers / Total followers.
Active followers are those who engaged in the last 30 days.
This metric measures follower quality.
100,000 followers, 10,000 active — 10% ratio.
10,000 followers, 5,000 active — 50% ratio.
Which is better? Obviously the latter.
Category 4: Conversion Metrics (3)
Conversion metrics measure whether your operations are delivering real value.
10. Link Click-Through Rate
Link clicks / Views.
This metric measures conversion from content to product.
High click-through rate means successful seeding.
Low click-through rate means there's a problem converting from content to product.
11. Conversion Rate
Conversions / Link clicks.
Conversions can be purchases, registrations, downloads, etc.
Conversion rate measures the attractiveness of the landing page.
High conversion rate means the product and price are competitive.
Low conversion rate means the landing page needs optimization.
12. ROI
Revenue / Cost.
This is the most important metric.
Positive ROI means operations are profitable.
Negative ROI means operations are losing money.
No matter how good the other metrics are, if ROI is negative, it's a failure.
How to Use These Metrics?
Now that you know the metrics, how do you use them?
Lao Zhang set rules for the team.
Check daily:
Impressions, views, engagement rate.
These 3 metrics — check daily to monitor content performance.
Check weekly:
Net follower growth, follower growth rate, active follower ratio.
These 3 metrics — check weekly to monitor account health.
Check monthly:
Link click-through rate, conversion rate, ROI.
These 3 metrics — check monthly to monitor operational effectiveness.
How to check?
Lao Zhang hung a whiteboard in the meeting room.
On the whiteboard was a table with 12 metrics, updated weekly.
"Data doesn't lie," Lao Zhang said, "good is good, bad is bad."
"If it's good, analyze why, replicate the experience."
"If it's bad, analyze why, improve and optimize."
"No excuses, no justifications."
"The data is there — face it, solve it."
What Changed in the Team After 3 Months?
Three months later, Lao Zhang called another operations meeting.
"How was last week's data?" Lao Zhang asked.
Xiao Li said: "Instagram impressions 500,000, views 100,000, engagement rate 8%, net follower growth 2,000, ROI 1:5."
Xiao Wang said: "LinkedIn impressions 300,000, views 150,000, engagement rate 12%, net follower growth 1,500, ROI 1:8."
Xiao Zhao said: "TikTok impressions 1 million, views 800,000, engagement rate 5%, net follower growth 5,000, ROI 1:3."
Lao Zhang nodded.
"Good," Lao Zhang said, "now you're speaking with data."
"But behind the data, what else is there?"
"Why is Instagram's engagement rate high?"
"Why is LinkedIn's ROI high?"
"Why are TikTok's impressions high?"
"Analyze the reasons, find patterns, replicate success."
"That's the value of data."
After the meeting, the team started deep analysis.
Instagram's high engagement rate was due to good content quality — users were willing to engage.
LinkedIn's high ROI was due to professional users with strong conversion intent.
TikTok's high impressions were due to algorithm recommendations and large traffic.
After finding patterns, the team started replicating successful experiences.
Instagram's content strategy was replicated to TikTok.
LinkedIn's conversion strategy was replicated to Instagram.
Three months later, overall ROI improved from 1:4 to 1:6.
"That's the power of data-driven operations," Lao Zhang said.
"Not by feeling, but by data."
"Not by guessing, but by finding patterns."
The Story Behind the Metrics
Lao Zhang told me a story.
"Once, I saw the engagement rate suddenly drop."
"From 8% to 3%."
"The team said it might be an algorithm change."
"I said it wasn't the algorithm — it was the content."
"We analyzed 100 pieces of content."
"And found a problem."
"During that period, we posted too many hard ads."
"Users didn't like it, so engagement dropped."
"Found the problem, immediately adjusted."
"Reduced hard ads, increased soft ads."
"Reduced selling, increased value."
"Two weeks later, engagement rate returned to 8%."
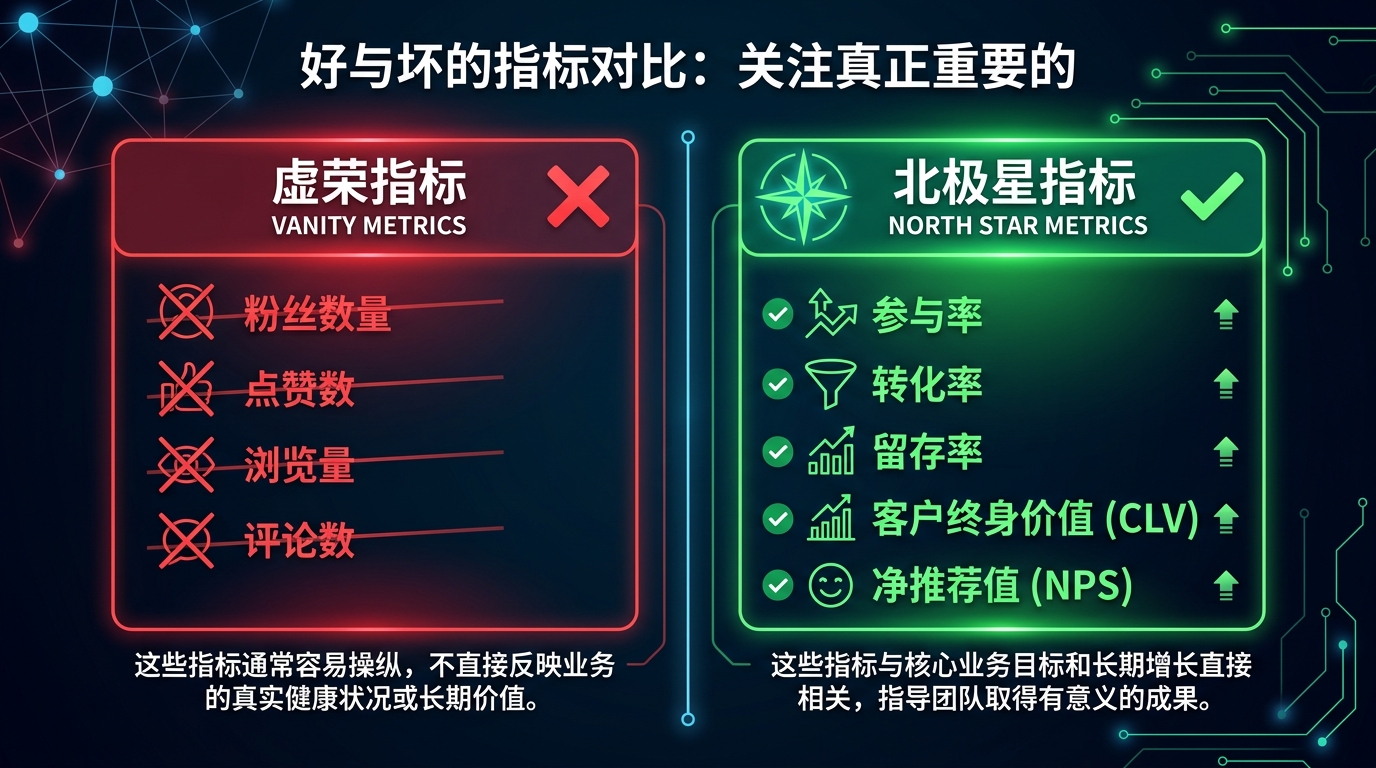
"So," Lao Zhang said, "data isn't just numbers."
"Data is user feedback."
"Engagement rate dropping isn't an algorithm problem — it's a content problem."
"Follower growth dropping isn't a platform problem — it's a value problem."
"Conversion rate dropping isn't a traffic problem — it's a product problem."
"Data tells you where the problem is."
"What you need to do is listen to the data."
Lao Zhang's Data Dashboard Template
Lao Zhang shared his data dashboard template with me.
Daily Report Template:
Date: YYYY-MM-DD
Platform: Instagram/LinkedIn/TikTok
Impressions: XXX
Views: XXX
Engagement Rate: X%
Content Published: X posts
Net Follower Growth: XXX
Weekly Report Template:
Week: Week X
Data summary for all platforms
Engagement rate trend chart
Follower growth trend chart
ROI analysis
Issues and improvements
Monthly Report Template:
Month: YYYY-MM
Monthly goal completion
ROI comparison by channel
Viral content analysis
Next month's goals and strategies
"Templates aren't important," Lao Zhang said, "what's important is consistency."
"Check daily, review weekly, optimize monthly."
"Stick with it for 3 months, and you'll see changes."
3 Tips for Operators
Based on team management experience, Lao Zhang gives 3 tips for other operators.
Tip 1: Build a data dashboard.
"Don't log into backends daily to check data," Lao Zhang said, "it's too cumbersome."
"Use tools to automatically aggregate data and generate dashboards."
"SocialEcho's Data Analytics feature can automatically aggregate data from all platforms."
"Open the dashboard daily — see all metrics at a glance."
Tip 2: Regular reviews.
"Data isn't just for looking at," Lao Zhang said, "it needs to be analyzed."
"Review weekly — analyze the reasons behind the data."
"Review monthly — summarize patterns, optimize strategies."
Tip 3: Use data to drive decisions.
"Don't make decisions by feeling," Lao Zhang said, "use data."
"What content works — data tells you."
"What time to publish — data tells you."
"Which platforms are worth investing in — data tells you."
"Data is your best teacher."
Lao Zhang's Team Management Insights
Lao Zhang doesn't just manage data — he manages the team.
"Data is cold," Lao Zhang said, "but the team is warm."
"How to balance?"
"Data-driven decisions, human management."
"Data-driven means decisions are based on data."
"Human management means motivation is personalized."
"For example, Xiao Li has good data — how to motivate?"
"Not just bonuses, but also recognition."
"Praise in team meetings, praise in company groups."
"Give him a sense of achievement."
"Xiao Wang has poor data — how to manage?"
"Not just criticism, but also help."
"One-on-one communication, find problems, provide support."
"Help him grow."
"Data is a tool, not a goal."
"The goal is team growth, business growth."
"So I look at data, and I look at people."
"Good data, happy people — that's truly good."
FAQ
Q1: Do I need to watch all 12 metrics?
Recommend watching all, but with different priorities. Engagement rate, ROI, and net follower growth are the 3 most important metrics — check them daily. Other metrics can be checked weekly or monthly. Adjust priorities based on business stage — focus on growth in early stages, focus on conversion in mature stages.
Q2: What are good metric benchmarks?
Different platforms, industries, and stages have different standards. Recommend comparing with your own historical data — continuous improvement is good. You can also compare with competitors to find gaps. SocialEcho's Competitor Monitoring feature can monitor competitor data.
Q3: Where to get data?
All platforms have data in their backends, but formats are inconsistent and aggregation is cumbersome. Recommend using tools like SocialEcho to automatically aggregate data from all platforms and generate unified dashboards. Data Analytics supports 10+ platforms.
Q4: How to analyze data?
Look at trends, not single points. Single-day data fluctuations are normal — look at weekly and monthly trends. Find patterns — what content has high engagement, what times perform best. Make comparisons — compare with your own history, compare with competitors.
Q5: Does SocialEcho offer a free trial?
SocialEcho offers a 7-day free trial with no credit card required. You can experience data analytics, competitor monitoring, and more — evaluate results before deciding.
Final Thoughts
This article has reached over 3,000 words.
But what I want to say goes beyond this.
Social media operations is a long-term endeavor.
Not overnight success, not shortcuts.
It's about consistently delivering value, sincerely communicating with users.
It's data-driven decisions, tool-enhanced efficiency.
I hope this article helps you.
If you have any questions, feel free to leave a comment.
Let's learn together, grow together.
Conclusion
Back to Lao Zhang's team.
Now, the team checks data daily, reviews weekly, optimizes monthly.
ROI improved from 1:4 to 1:6, follower growth 3x, team efficiency improved 50%.
"We used to do operations by feeling," Lao Zhang said, "now we're data-driven."
"Feelings can deceive, data doesn't."
"Feelings change, data is stable."
"Data is your best teacher — listen to it."
Try free for 7 days — SocialEcho, experience data-driven efficient operations. Don't let feelings replace data, don't let guessing replace analysis.
Have questions? Feel free to leave a comment, or visit the SocialEcho Help Center for more support.
Want to try? Free 7-day trial of SocialEcho, no credit card required, start data-driven operations now.
Note: This article is based on real cases, character names are pseudonyms. Any resemblance is coincidental. Social media operations require continuous learning — follow the SocialEcho official account for more practical tips.
Word count: 3,200 words | Reading time: 10 minutes
;}.cls-2{fill:%230868f7;}.cls-3{fill:url(%23未命名的渐变_44);}.cls-4{fill:%23333;}%3c/style%3e%3clinearGradient%20id='未命名的渐变_8'%20x1='33.73'%20y1='100.61'%20x2='-0.03'%20y2='-1.06'%20gradientUnits='userSpaceOnUse'%3e%3cstop%20offset='0'%20stop-color='%237ae9fb'/%3e%3cstop%20offset='0.67'%20stop-color='%232b90f8'/%3e%3cstop%20offset='1'%20stop-color='%230868f7'/%3e%3c/linearGradient%3e%3clinearGradient%20id='未命名的渐变_44'%20x1='27.86'%20y1='18.67'%20x2='68.36'%20y2='22.22'%20gradientUnits='userSpaceOnUse'%3e%3cstop%20offset='0'%20stop-color='%235ac7f2'/%3e%3cstop%20offset='1'%20stop-color='%230868f7'/%3e%3c/linearGradient%3e%3c/defs%3e%3cpath%20class='cls-1'%20d='M29,28.74V81.91l-9.51-3.68v0L8.52,74A7.17,7.17,0,0,1,4,67.32V24.54A3.76,3.76,0,0,1,9.08,21Z'/%3e%3cpath%20class='cls-2'%20d='M68.09,78.07a13.15,13.15,0,0,1-17.9,12.06L29,81.91h0V28.74L50.19,37A13.17,13.17,0,0,0,68.08,25.3h0Z'/%3e%3cpath%20class='cls-3'%20d='M68.08,25.3a13.19,13.19,0,0,1-6.73,10.87A13.09,13.09,0,0,1,50.19,37L29,28.74V6A3.76,3.76,0,0,1,34.1,2.52l25.59,9.91A13.22,13.22,0,0,1,68.08,25.3Z'/%3e%3cpath%20class='cls-4'%20d='M129.06,81.76a4.33,4.33,0,0,1-3.19-1.31,4.4,4.4,0,0,1-1.31-3.24V56.86H97.65V77.21a4.36,4.36,0,0,1-1.35,3.2A4.68,4.68,0,0,1,93,81.76a4.32,4.32,0,0,1-3.19-1.31,4.37,4.37,0,0,1-1.32-3.24V27.27A4.58,4.58,0,0,1,89.83,24a4.59,4.59,0,0,1,7.82,3.27V48.15h26.91V27.27A4.58,4.58,0,0,1,125.91,24a4.59,4.59,0,0,1,7.82,3.27V77.21a4.37,4.37,0,0,1-1.36,3.2A4.65,4.65,0,0,1,129.06,81.76Z'/%3e%3cpath%20class='cls-4'%20d='M163.77,81.66c-6.57,0-11.76-1.92-15.44-5.7s-5.54-9.07-5.54-15.74a26.76,26.76,0,0,1,2.09-10.43,17.72,17.72,0,0,1,6.67-8.06,19.15,19.15,0,0,1,10.68-2.95,19,19,0,0,1,10.46,2.8,18.7,18.7,0,0,1,6.55,7.36,22.53,22.53,0,0,1,2.36,10.28A4.51,4.51,0,0,1,177,63.77H152.23a10.8,10.8,0,0,0,3.49,6.65c2,1.68,4.88,2.52,8.66,2.52a22.25,22.25,0,0,0,7.54-1.21c.74-.3,1.55-.67,2.37-1.07a3.75,3.75,0,0,1,1.84-.4,4.09,4.09,0,0,1,3,1.15,4,4,0,0,1,1.12,3,4.38,4.38,0,0,1-2.58,3.82,32.34,32.34,0,0,1-6.36,2.61A28.67,28.67,0,0,1,163.77,81.66ZM172.4,55.9a9.72,9.72,0,0,0-1.63-4.56A9.9,9.9,0,0,0,167,48a10.38,10.38,0,0,0-4.64-1.14,12,12,0,0,0-4.77,1.06,9.54,9.54,0,0,0-4.89,5.66,11.78,11.78,0,0,0-.51,2.3Z'/%3e%3cpath%20class='cls-4'%20d='M193,81.64a4.49,4.49,0,0,1-4.51-4.55V27.28A4.58,4.58,0,0,1,189.84,24a4.48,4.48,0,0,1,3.28-1.36A4.36,4.36,0,0,1,196.35,24a4.46,4.46,0,0,1,1.31,3.31V77.09a4.34,4.34,0,0,1-1.35,3.2A4.67,4.67,0,0,1,193,81.64Z'/%3e%3cpath%20class='cls-4'%20d='M263.79,81.71a5.7,5.7,0,0,1-4.2-1.74,5.76,5.76,0,0,1-1.73-4.19V27.37a4.58,4.58,0,0,1,1.35-3.27A4.59,4.59,0,0,1,267,27.37V72.53h24a4.58,4.58,0,0,1,3.27,7.82A4.66,4.66,0,0,1,291,81.71Z'/%3e%3cpath%20class='cls-4'%20d='M424.48,81.74a4.71,4.71,0,0,1-2.71-.88,5.43,5.43,0,0,1-1-1l-.07-.09-12.41-17-5.41,5v9.44a4.31,4.31,0,0,1-1.36,3.19,4.66,4.66,0,0,1-3.3,1.36A4.29,4.29,0,0,1,395,80.42a4.36,4.36,0,0,1-1.32-3.23V27.37A4.58,4.58,0,0,1,395,24.1a4.52,4.52,0,0,1,6.58.12,4.54,4.54,0,0,1,1.24,3.15V56.31l17.72-16.38.05,0a4.8,4.8,0,0,1,2.94-1.11,4.4,4.4,0,0,1,3.27,1.2,4.57,4.57,0,0,1,1.2,3.27,4.44,4.44,0,0,1-.77,2.33,7.45,7.45,0,0,1-1.43,1.65l-11,9.64,13.34,17.68a5,5,0,0,1,1,2.71,4.12,4.12,0,0,1-1.36,3.24A4.64,4.64,0,0,1,424.48,81.74Z'/%3e%3cpath%20class='cls-4'%20d='M317.93,81.76a21.5,21.5,0,1,1,21.17-21.5A21.37,21.37,0,0,1,317.93,81.76Zm0-34.1a12.61,12.61,0,1,0,12.42,12.6A12.52,12.52,0,0,0,317.93,47.66Z'/%3e%3cpath%20class='cls-4'%20d='M212.18,101.22a4.12,4.12,0,0,1-3.05-1.26,4.17,4.17,0,0,1-1.26-3.1V43.34a4.37,4.37,0,0,1,1.3-3.14,4.26,4.26,0,0,1,3.13-1.3,4.19,4.19,0,0,1,3.1,1.26,4.32,4.32,0,0,1,1.26,3.16,20.77,20.77,0,0,1,13-4.54,21.51,21.51,0,0,1,0,43,20.51,20.51,0,0,1-13-4.57V96.86a4.15,4.15,0,0,1-1.3,3.06A4.5,4.5,0,0,1,212.18,101.22Zm17.43-53.63c-6.23,0-12.93,4.11-12.93,12.72a12.73,12.73,0,0,0,25.46,0A12.71,12.71,0,0,0,229.61,47.59Z'/%3e%3cpath%20class='cls-4'%20d='M365.76,81.76a21.5,21.5,0,1,1,21.18-21.5A21.37,21.37,0,0,1,365.76,81.76Zm0-34.1a12.61,12.61,0,1,0,12.42,12.6A12.52,12.52,0,0,0,365.76,47.66Z'/%3e%3c/svg%3e)