Five key competitor data dimensions brands must monitor for social media marketing in 2026.
Five key competitor data dimensions brands must monitor for social media marketing in 2026.
Product manager Zhang Qing lingered for a long time when she first saw a competitor's Instagram account. She counted: the competitor's account had less than half the number of followers of her brand, but each video received three times the number of comments, and the pinned comments were full of users recommending the product to each other.
She opened the backend of her brand, which had a larger number of followers and more exquisite content, but the comment section was deserted.
"The numbers are fine, but where did things go wrong?" She couldn't figure it out at the time.
Three months later, after she established a systematic competitor data monitoring system, she realized that the number of followers was never the core metric. She had been focusing on the wrong dimension.
This is the most common mistake in competitor analysis for overseas brand operations in 2026.

Why are most competitive analyses ineffective?
Opening a competitor's account, thinking "Oh, they're posting this kind of content," and then closing it—that's not competitor analysis, that's just "visiting."
Truly valuable competitive analysis answers actionable strategic questions :
- In which content direction did the competitors achieve unexpected returns?
- On which platform are they increasing their investment?
- Is their user retention rate better or worse than ours?
- What adjustments have they made recently?
To answer these questions, you need to systematically track five data dimensions, rather than just "feeling" from your impressions.
Dimension 1: Content engagement rate (not absolute number)
What to look at : The engagement rate is calculated by dividing the number of interactions for each piece of content by the number of followers.
Why it matters : An account with 1 million followers, a video with 400 likes, and an engagement rate of only 0.04% – that's a bad account. An account with 10,000 followers, a video with 300 likes, and an engagement rate of 3% – that's an active account.
If you only look at the absolute number of interactions, you will be misled by the numbers of big accounts; only by looking at the ratio can you assess the true influence of competitors' content.
How to use it : Compare the interaction rates of different content types from competitors (videos vs. text/images vs. carousels) to find out which type of content is most efficient . If a competitor's pure product display videos have a low interaction rate, but user story content has a three times higher interaction rate, this is a clear signal: users in this market prefer emotionally resonant content.
Tool support : Use Instagram competitor analysis or TikTok data analysis to track the content performance of competitor accounts in batches without having to manually calculate each post individually.
Dimension Two: Content Release Frequency and Pace
What to look at : the frequency of competitors' weekly/monthly releases, and the distribution of release times.
Why it matters : Changes in frequency and rhythm are early signals of competitors' strategic adjustments.
When a competitor suddenly increases their TikTok posting frequency from 3 posts per week to 1 post per day, it means they are increasing their investment in the platform; when their updates on one of their platforms suddenly stop, it may be because they have determined that the ROI is not good and have reduced their budget.
These signals are impossible to spot if you only "visit" competitor accounts once a month. You need to continuously track and observe trends, not just look at snapshots of a particular moment .
How to use it : Create a competitor posting frequency tracking table and update it monthly. When you find that a competitor's posting frequency on a certain platform is continuously increasing, you need to analyze whether their content is gaining or losing followers—if they increase their investment and the data improves, you also need to reconsider your resource allocation on the same platform.
If multiple competitors simultaneously increase their investment in a particular platform, this is a market signal indicating that the platform's ROI may be improving within that product category.
Dimension 3: Fan growth rate (not just total number)
What to look at : Monthly/weekly net increase in followers of competitor accounts
Why it matters : Existing fans are history; increasing them is the most direct reflection of whether current strategies are effective.
Many people feel pressured when they see a competitor with 500,000 followers, but if those 500,000 followers were accumulated slowly over the past three years and the net increase is only 500 people per month in the last six months, it means that their content has actually stagnated—you are chasing a target that is losing momentum.
Conversely, a new account with 30,000 followers that gains a net increase of 2,000 followers per month for the past three months indicates that they have found an effective growth method, and these are the competitors you should closely monitor.
How to use it : Focus on monitoring competitors with rapid growth rates, analyzing what content they've posted recently, and whether they've collaborated with KOLs or participated in hashtag challenges. Use competitor monitoring tools to track the follower growth curves of multiple competitor accounts and compare them to find patterns.
Dimension 4: Sentiment Distribution of Comments
What to look at : The ratio of positive/negative/neutral sentiment in competitors' comment sections, and the high-frequency words in negative comments.
Why it's important : This is the most easily overlooked yet most valuable dimension.
Where negative sentiment is concentrated in competitors' review sections is where your opportunity for differentiation lies. Do users complain about competitors' packaging design? Slow customer service response? Insufficient features? These are all differentiating points you can emphasize in your own content and product.
More importantly, changes in sentiment in the comments section can be warning signs. If negative comments about competitors suddenly increase within a certain period, it may indicate a problem with their product/service or a public relations crisis—this is when your opportunity arises.
YouTube comment management tools can be used to perform sentiment analysis on competitor comment sections and identify frequently complained topics by users.
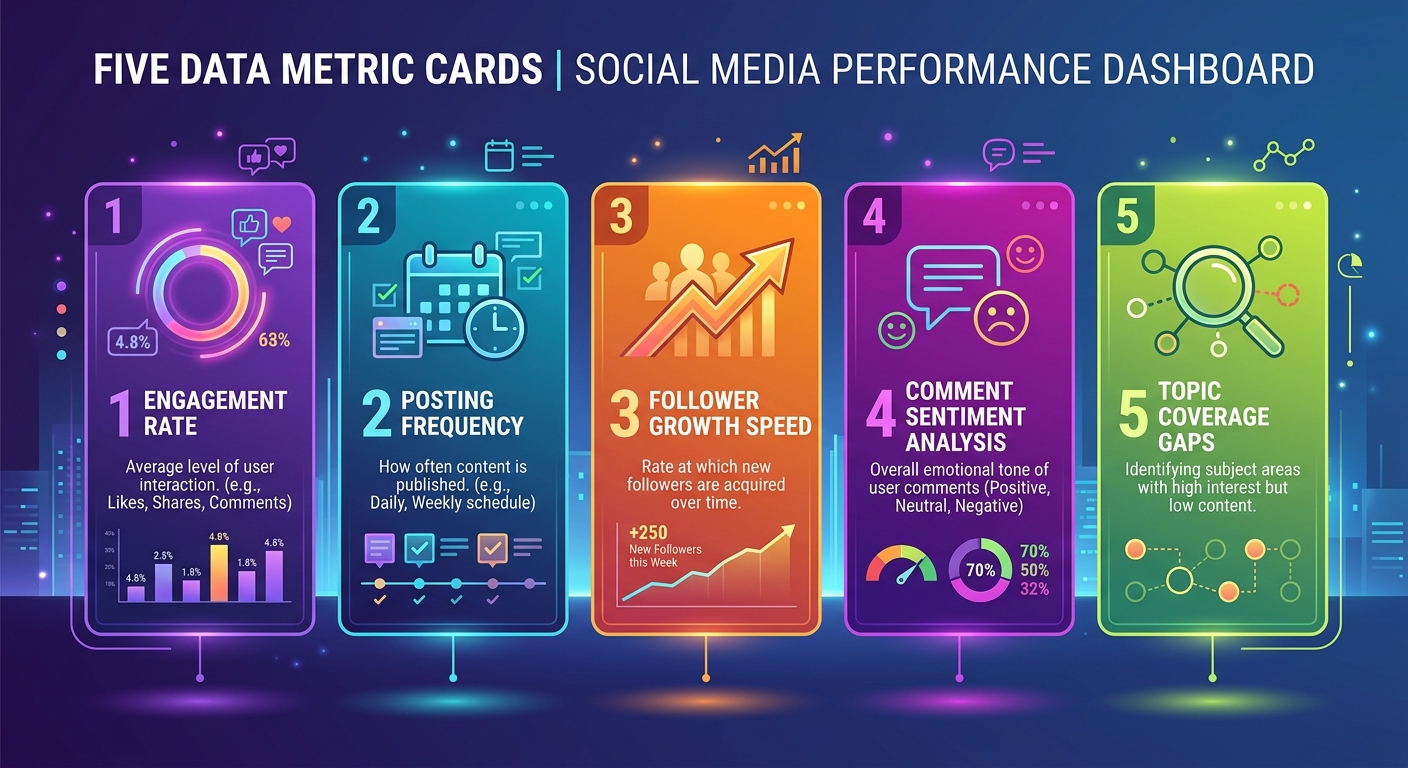
Dimension 5: Content Topic Distribution and Coverage Gaps
What to look at : How much content competitors have posted on which topics, and which topics they haven't covered at all.
Why it's important : This is the most direct way to find blue ocean topics.
Topics already covered by competitors don't mean you can't do them, but you need to do them better or from a different angle to compete. High-demand topics that competitors haven't covered represent opportunities for you to gain a foothold.
How to use it : Categorize competitors' content from the past six months into topics (product showcases/user testimonials/tutorials/holiday marketing/KOL collaborations, etc.). Calculate the number of topics and average engagement rate for each category.
You'll often find that competitors focus 80% of their content on 2-3 topic types, while they only post 1-2 posts on certain highly interactive topics before stopping. These "touching the surface" topics are often directions they've tested but haven't explored in depth—if this direction has a high interaction rate, it's your entry point.
In conjunction with YouTube competitor analysis, conduct a systematic topic distribution analysis to identify topics that are not covered by competitors.
How to use the five dimensions in a comprehensive way
Looking at any single dimension in isolation can lead to misjudgment. Systematic competitive analysis requires considering all five dimensions together:
Scenario 1: Competitors have high engagement rates but slow follower growth. Possible reasons: The content is very attractive to existing fans, but there's no mechanism to "break out" and reach new users. Your opportunity: Capture search-related topics they haven't yet covered to reach new users.
Scenario 2: Competitors gain followers quickly but have low engagement rates. Possible reasons: They are running paid ads or KOL promotions, resulting in lower-quality followers. Your opportunity: Focus on precise content to attract higher-quality followers; although the number may be smaller, the conversion rate will be stronger.
Scenario 3: A competitor's content type suddenly experiences a surge in engagement. Possible reason: They've found a new topic direction. Your action: Immediately analyze the structure and topics of this type of content and consider whether to follow suit.
Scenario 4: A Surge in Negative Sentiment in Competitor Product Comment Sections Possible Causes: Product Issues or Service Crisis. Your Actions: Create content such as "What is our solution?" to retain lost competitor users.
Implementation: From "Feeling" to "Mechanism"
The biggest obstacle to establishing a competitor data monitoring system is not technology, but perseverance.
Most teams start with diligent analysis, but become complacent after a month because manually collecting and organizing data is too time-consuming. The solution is to automate the manual work:
- Use tools to set up competitor account tracking and automatically receive notifications for new content releases.
- Review the monthly competitor data summary report at a fixed time each month (e.g., the first day of the month).
- Incorporating analytical findings into the monthly content strategy is not just about archiving.
SocialEcho's social media monitoring feature supports tracking multiple competitor accounts simultaneously, allowing you to see all competitors' latest updates in one dashboard, eliminating the need to log in to each platform daily. Basic plan starts at 12.5/month, Team plan starts at 18.75/month, with a 20% discount for annual payments.
Prioritization of competitor data across multiple platforms
For most brands going global, resources are limited, making it impossible to fully utilize every aspect of every platform. Recommended priority order:
Tier 1 (Required) : Comprehensive five-dimensional monitoring of your primary platform (the one you invest the most in) . Tier 2 (Monthly) : Dimension 1 (Interaction Rate) + Dimension 5 (Topic Distribution) of secondary platforms . Tier 3 (Quarterly) : Quick scan of other platforms, mainly to see if any new competitors emerge.
Concentrate resources on core platforms, focusing on in-depth rather than broad but shallow approaches.

FAQ
Q: How many competitors should I monitor? A: 3-5 core competitors are enough. Too few provide no comparison, too many are distracting. Selection criteria: High overlap with your product category, overlapping positioning, and better content presentation than yours.
Q: Do I need to review these 5 dimensions every day? A: No. You can set up real-time reminders for competitor content releases, but a complete five-dimensional analysis is recommended monthly, along with a strategy review based on the month's content performance.
Q: Can competitor data be obtained directly from the platform? A: Platforms have certain restrictions on access to third-party data, but interaction data for publicly available content (likes, comments, views) can be tracked. Professional tools collect data through official APIs or public pages, ensuring compliance and stability.
Q: Which platforms does SocialEcho support for competitor monitoring? A: SocialEcho supports tracking competitor accounts on major platforms such as YouTube, Instagram, TikTok, Facebook, and X, allowing you to view competitor activities on various platforms from a single workbench.
Q: If a competitor's account is private, can it still be monitored? A: The content of private accounts is not publicly available and cannot be tracked. However, most large-scale brand accounts are public accounts, and private accounts are usually not within the scope of competitor analysis.
Q: After conducting competitive analysis, how can I avoid "following the crowd" and losing my own style? A: The purpose of competitive analysis is to discover opportunities, not to copy others. The standard is: when competitors are doing well, you should refer to the "direction of user needs," not the "specific content format." Your differentiating factors must be retained.
Q: Do I need AI tools for sentiment analysis of comments? A: AI is more efficient for sentiment analysis of a large number of comments, but if the volume is small (less than 200 comments per analysis), manual classification is also acceptable. The key is to establish a fixed classification system and use the same standards each time to ensure comparable results.
;}.cls-2{fill:%230868f7;}.cls-3{fill:url(%23未命名的渐变_44);}.cls-4{fill:%23333;}%3c/style%3e%3clinearGradient%20id='未命名的渐变_8'%20x1='33.73'%20y1='100.61'%20x2='-0.03'%20y2='-1.06'%20gradientUnits='userSpaceOnUse'%3e%3cstop%20offset='0'%20stop-color='%237ae9fb'/%3e%3cstop%20offset='0.67'%20stop-color='%232b90f8'/%3e%3cstop%20offset='1'%20stop-color='%230868f7'/%3e%3c/linearGradient%3e%3clinearGradient%20id='未命名的渐变_44'%20x1='27.86'%20y1='18.67'%20x2='68.36'%20y2='22.22'%20gradientUnits='userSpaceOnUse'%3e%3cstop%20offset='0'%20stop-color='%235ac7f2'/%3e%3cstop%20offset='1'%20stop-color='%230868f7'/%3e%3c/linearGradient%3e%3c/defs%3e%3cpath%20class='cls-1'%20d='M29,28.74V81.91l-9.51-3.68v0L8.52,74A7.17,7.17,0,0,1,4,67.32V24.54A3.76,3.76,0,0,1,9.08,21Z'/%3e%3cpath%20class='cls-2'%20d='M68.09,78.07a13.15,13.15,0,0,1-17.9,12.06L29,81.91h0V28.74L50.19,37A13.17,13.17,0,0,0,68.08,25.3h0Z'/%3e%3cpath%20class='cls-3'%20d='M68.08,25.3a13.19,13.19,0,0,1-6.73,10.87A13.09,13.09,0,0,1,50.19,37L29,28.74V6A3.76,3.76,0,0,1,34.1,2.52l25.59,9.91A13.22,13.22,0,0,1,68.08,25.3Z'/%3e%3cpath%20class='cls-4'%20d='M129.06,81.76a4.33,4.33,0,0,1-3.19-1.31,4.4,4.4,0,0,1-1.31-3.24V56.86H97.65V77.21a4.36,4.36,0,0,1-1.35,3.2A4.68,4.68,0,0,1,93,81.76a4.32,4.32,0,0,1-3.19-1.31,4.37,4.37,0,0,1-1.32-3.24V27.27A4.58,4.58,0,0,1,89.83,24a4.59,4.59,0,0,1,7.82,3.27V48.15h26.91V27.27A4.58,4.58,0,0,1,125.91,24a4.59,4.59,0,0,1,7.82,3.27V77.21a4.37,4.37,0,0,1-1.36,3.2A4.65,4.65,0,0,1,129.06,81.76Z'/%3e%3cpath%20class='cls-4'%20d='M163.77,81.66c-6.57,0-11.76-1.92-15.44-5.7s-5.54-9.07-5.54-15.74a26.76,26.76,0,0,1,2.09-10.43,17.72,17.72,0,0,1,6.67-8.06,19.15,19.15,0,0,1,10.68-2.95,19,19,0,0,1,10.46,2.8,18.7,18.7,0,0,1,6.55,7.36,22.53,22.53,0,0,1,2.36,10.28A4.51,4.51,0,0,1,177,63.77H152.23a10.8,10.8,0,0,0,3.49,6.65c2,1.68,4.88,2.52,8.66,2.52a22.25,22.25,0,0,0,7.54-1.21c.74-.3,1.55-.67,2.37-1.07a3.75,3.75,0,0,1,1.84-.4,4.09,4.09,0,0,1,3,1.15,4,4,0,0,1,1.12,3,4.38,4.38,0,0,1-2.58,3.82,32.34,32.34,0,0,1-6.36,2.61A28.67,28.67,0,0,1,163.77,81.66ZM172.4,55.9a9.72,9.72,0,0,0-1.63-4.56A9.9,9.9,0,0,0,167,48a10.38,10.38,0,0,0-4.64-1.14,12,12,0,0,0-4.77,1.06,9.54,9.54,0,0,0-4.89,5.66,11.78,11.78,0,0,0-.51,2.3Z'/%3e%3cpath%20class='cls-4'%20d='M193,81.64a4.49,4.49,0,0,1-4.51-4.55V27.28A4.58,4.58,0,0,1,189.84,24a4.48,4.48,0,0,1,3.28-1.36A4.36,4.36,0,0,1,196.35,24a4.46,4.46,0,0,1,1.31,3.31V77.09a4.34,4.34,0,0,1-1.35,3.2A4.67,4.67,0,0,1,193,81.64Z'/%3e%3cpath%20class='cls-4'%20d='M263.79,81.71a5.7,5.7,0,0,1-4.2-1.74,5.76,5.76,0,0,1-1.73-4.19V27.37a4.58,4.58,0,0,1,1.35-3.27A4.59,4.59,0,0,1,267,27.37V72.53h24a4.58,4.58,0,0,1,3.27,7.82A4.66,4.66,0,0,1,291,81.71Z'/%3e%3cpath%20class='cls-4'%20d='M424.48,81.74a4.71,4.71,0,0,1-2.71-.88,5.43,5.43,0,0,1-1-1l-.07-.09-12.41-17-5.41,5v9.44a4.31,4.31,0,0,1-1.36,3.19,4.66,4.66,0,0,1-3.3,1.36A4.29,4.29,0,0,1,395,80.42a4.36,4.36,0,0,1-1.32-3.23V27.37A4.58,4.58,0,0,1,395,24.1a4.52,4.52,0,0,1,6.58.12,4.54,4.54,0,0,1,1.24,3.15V56.31l17.72-16.38.05,0a4.8,4.8,0,0,1,2.94-1.11,4.4,4.4,0,0,1,3.27,1.2,4.57,4.57,0,0,1,1.2,3.27,4.44,4.44,0,0,1-.77,2.33,7.45,7.45,0,0,1-1.43,1.65l-11,9.64,13.34,17.68a5,5,0,0,1,1,2.71,4.12,4.12,0,0,1-1.36,3.24A4.64,4.64,0,0,1,424.48,81.74Z'/%3e%3cpath%20class='cls-4'%20d='M317.93,81.76a21.5,21.5,0,1,1,21.17-21.5A21.37,21.37,0,0,1,317.93,81.76Zm0-34.1a12.61,12.61,0,1,0,12.42,12.6A12.52,12.52,0,0,0,317.93,47.66Z'/%3e%3cpath%20class='cls-4'%20d='M212.18,101.22a4.12,4.12,0,0,1-3.05-1.26,4.17,4.17,0,0,1-1.26-3.1V43.34a4.37,4.37,0,0,1,1.3-3.14,4.26,4.26,0,0,1,3.13-1.3,4.19,4.19,0,0,1,3.1,1.26,4.32,4.32,0,0,1,1.26,3.16,20.77,20.77,0,0,1,13-4.54,21.51,21.51,0,0,1,0,43,20.51,20.51,0,0,1-13-4.57V96.86a4.15,4.15,0,0,1-1.3,3.06A4.5,4.5,0,0,1,212.18,101.22Zm17.43-53.63c-6.23,0-12.93,4.11-12.93,12.72a12.73,12.73,0,0,0,25.46,0A12.71,12.71,0,0,0,229.61,47.59Z'/%3e%3cpath%20class='cls-4'%20d='M365.76,81.76a21.5,21.5,0,1,1,21.18-21.5A21.37,21.37,0,0,1,365.76,81.76Zm0-34.1a12.61,12.61,0,1,0,12.42,12.6A12.52,12.52,0,0,0,365.76,47.66Z'/%3e%3c/svg%3e)