In-depth analysis of the 2026 Social Media Engagement Report: Data insights from 52 million+ posts
I. Introduction: When 52 million posts tell us the truth
On March 5, 2026, Buffer released a major report – the "State of Social Media Engagement 2026 Report". This is not just another "expert opinion" or "trend prediction", but a hardcore data analysis based on more than 52 million real posts , covering 10 major platforms including Facebook, Instagram, LinkedIn, TikTok, X, Threads, Pinterest, Bluesky, Mastodon, and YouTube.
For operations staff who battle on social media every day, this report is like a treasure map—it not only tells you "where the treasure is" (which strategies are effective), but also "why it's there" (the data logic behind it).
This article will provide an in-depth analysis of the report's five key findings:
- The amazing effect of replying to comments - Replying to comments on Threads can increase engagement by 42%.
- Platform engagement benchmarks - LinkedIn leads with 6.2%, while X lags behind at only 2.5%.
- Annual Trends - X engagement surged 44%, while Instagram declined 26%.
- Platform differences in content formats - Instagram's "dual nature," LinkedIn's carousel advantages
- Posting frequency and "penalty for not posting" - A week without posting results in a significant drop in growth rate.
If you're struggling with questions like "What content to post," "When to post," and "How to improve engagement," this article will provide you with data-driven answers.
II. 2026 Platform Participation Benchmarks: Who is the Winner?
Participation Ranking
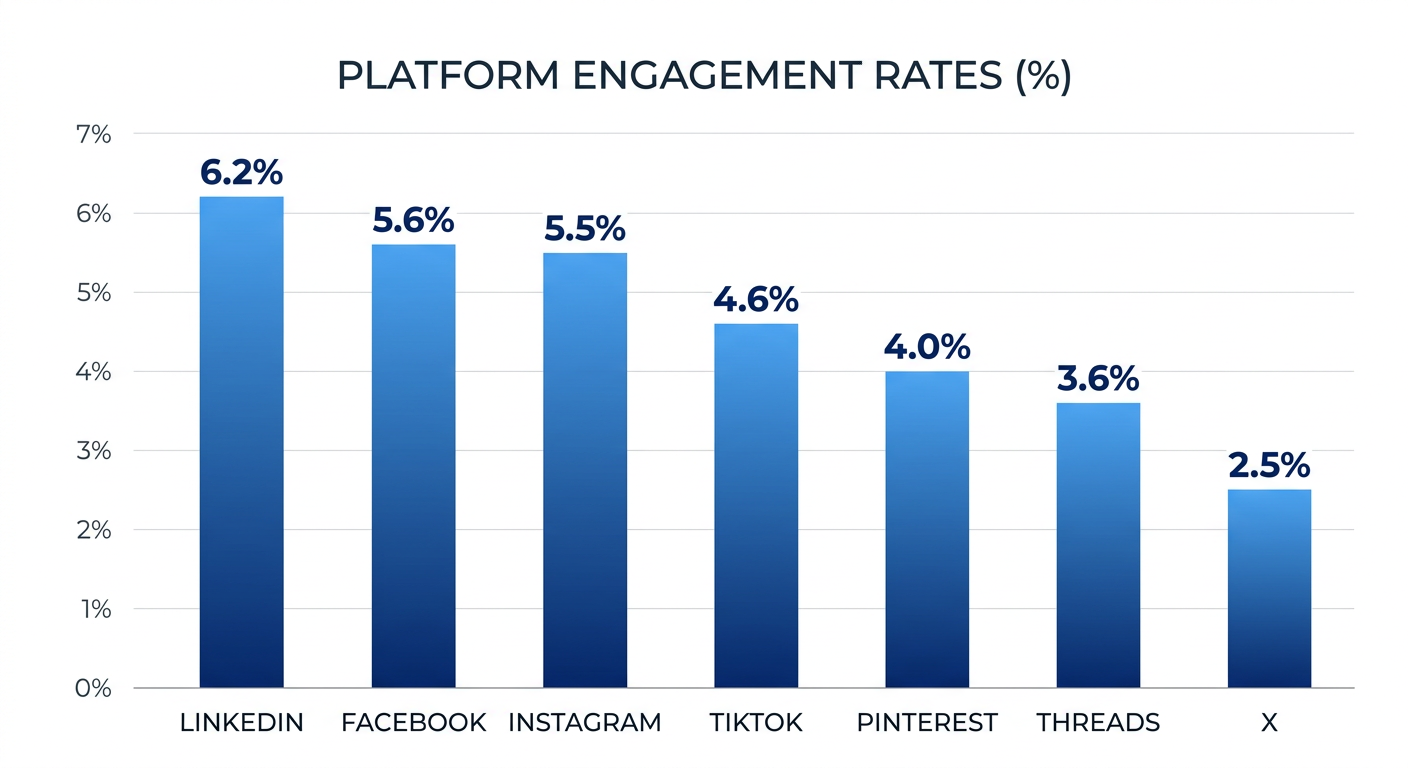
Based on Buffer's analysis of over 52 million posts, the average engagement rate across platforms in 2025 is as follows:
| platform | Participation | Ranking |
|---|---|---|
| 6.2% | 🥇 | |
| 5.6% | 🥈 | |
| 5.5% | 🥉 | |
| TikTok | 4.6% | 4 |
| 4.0% | 5 | |
| Threads | 3.6% | 6 |
| X (Twitter) | 2.5% | 7 |
Why is LinkedIn leading the way?
LinkedIn's 6.2% engagement rate is no accident. As a professional networking platform, its users tend to:
- In-depth reading and thinking about content
- Interact with professional content (likes, comments, shares)
- Building professional relationships and personal branding
In contrast, while X (formerly Twitter) had the lowest engagement rate of 2.5%, this does not mean that X is not worth investing in—its value lies in its speed of dissemination and ability to generate buzz , rather than simply the engagement numbers.
Annual changes: Who is rising and who is falling?
Even more interesting are the trends for 2024-2025: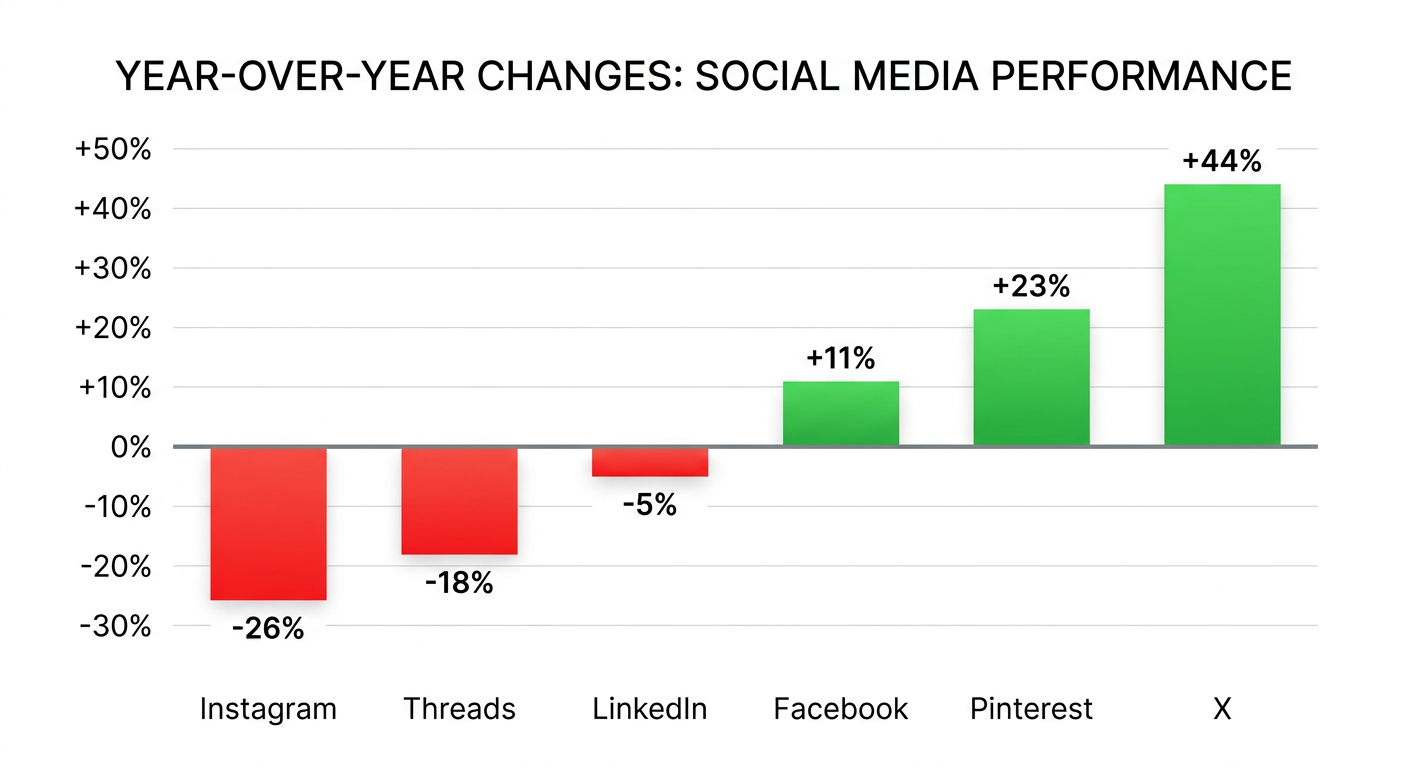
Fastest growing platform:
- X : +44% (from 1.7% to 2.5%)
- Pinterest : +23% (from 3.3% to 4.0%)
- Facebook : +11% (from 5.0% to 5.6%)
The platform with the most significant decline:
- Instagram : -26% (down from 7.4% to 5.5%)
- Threads : -18% (from 4.4% to 3.6%)
- LinkedIn : -5% (down from 6.5% to 6.2%)
Why was X able to make a comeback?
The 44% surge in X's engagement may be related to the following factors:
- The platform's algorithm has been adjusted to place greater emphasis on the quality of interaction.
- Changes in user behavior: more willing to participate in discussions
- Competitors (such as Threads) have diverted users from "low-quality interactions".
Why is Instagram declining?
The 26% drop in Instagram engagement may be due to:
- Platform content overload, user attention scattered
- The rise of Reels has changed user behavior (more watching, less interacting).
- Algorithm adjustments reduced organic reach.
How do I set reasonable goals for my account?
These benchmarks are not "passing grades," but rather "industry averages." Your goals should be based on:
- Your industry – B2B brands might account for over 10% on LinkedIn, but only 2% on TikTok.
- Your content type - Educational content typically has higher engagement rates than promotional content.
- Your follower size - small account (
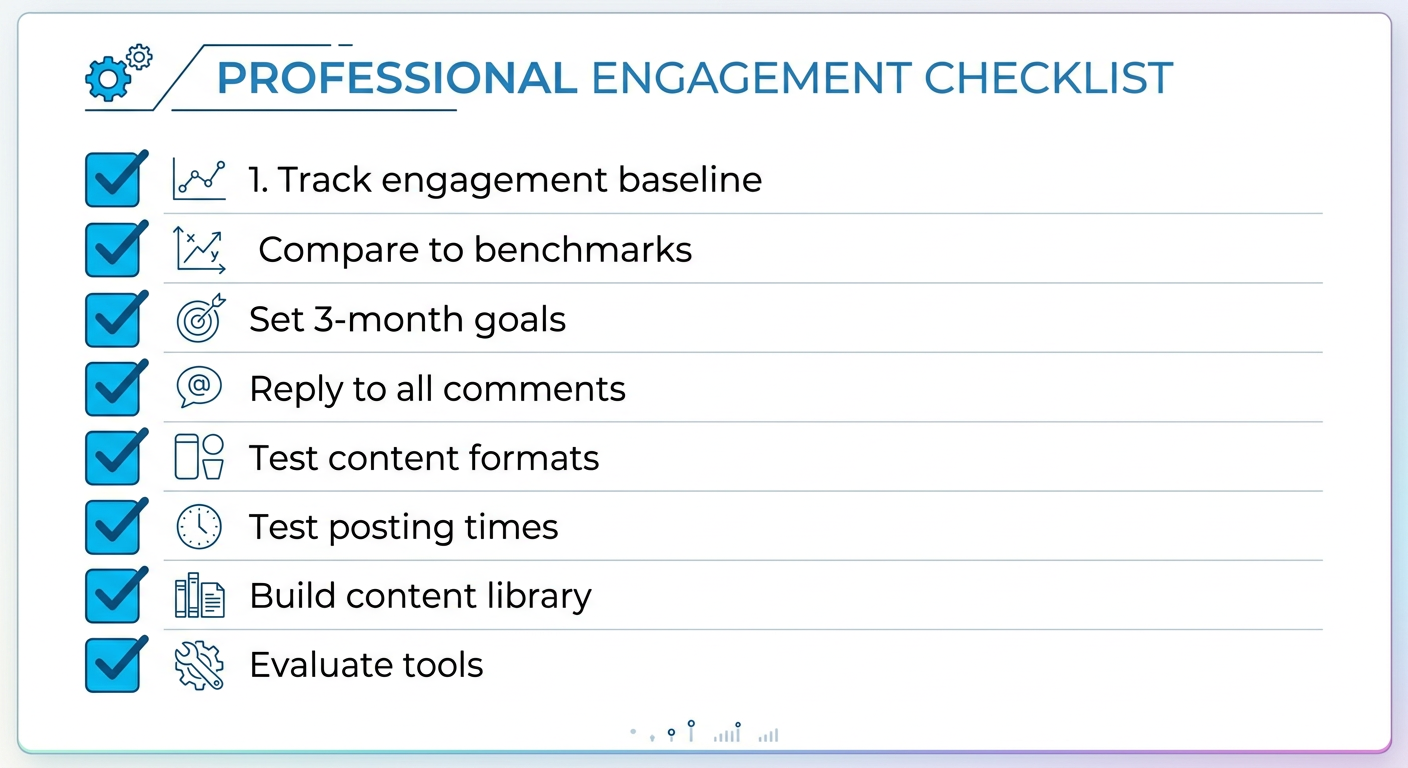
Practical suggestions:
- First, record your current engagement benchmark.
- Compare with industry averages to identify gaps
- Set improvement goals for 3-6 months (e.g., increase from 3% to 4%).
- Track progress monthly and adjust strategies accordingly.
III. The Amazing Effect of Replying to Comments: The Strongest Signal Isn't Technique, But Sincerity
The most striking finding in the Buffer report is that replying to comments has a far greater impact on engagement than any "trick" or "hack".
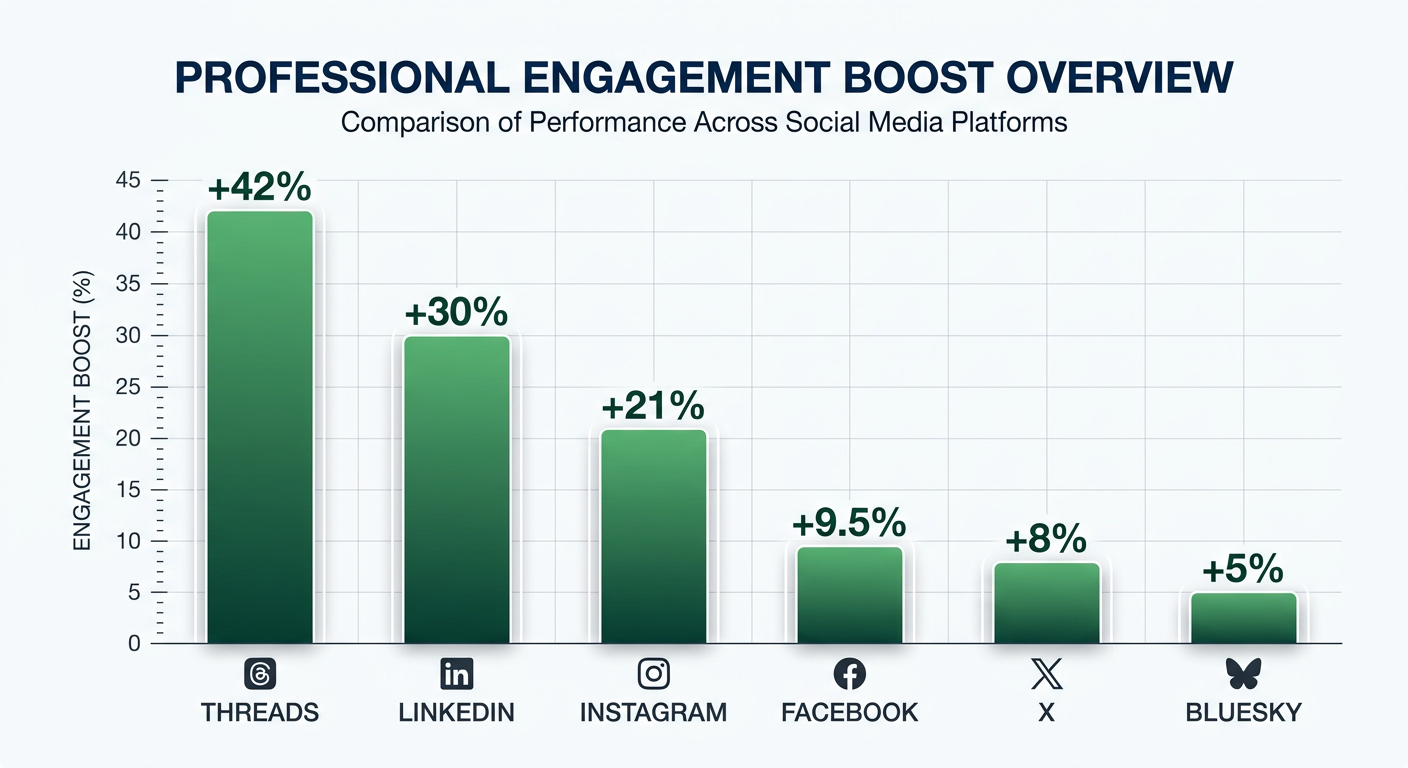
Cross-platform data: Increased engagement in replying to comments
| platform | Increased participation |
|---|---|
| Threads | +42% |
| +30% | |
| +21% | |
| +9.5% | |
| X | +8% |
| Bluesky | +5% |
Why are replying to comments so effective?
- Algorithm Rewards - Most platforms' algorithms recommend "interactive posts" to more people.
- Community atmosphere - Replying to comments makes users feel "seen," making them more willing to interact again.
- Further discussion in the comments section can extend the "lifespan" of a post.
- Building Trust - Brands proactively respond to comments, sending a signal that "we care about you".
Why are Threads the most effective?
Threads, launched by Meta as a "Twitter alternative," places great emphasis on "conversation quality" in its algorithm. When you reply to a comment, the algorithm considers it "high-quality content" and recommends it to more users.
Practical advice: How to reply to comments efficiently?
1. Prioritize replying to comments from the first 24 hours.
- The first 24 hours after a post is published are the "golden window."
- The interaction during this period will directly affect the algorithm's recommendations.
2. Don't just reply with "thank you".
- Raise questions to guide further discussion
- Share additional information or resources
- Tag other relevant users
3. Use tools to improve efficiency
- If you manage multiple platforms, manually replying to comments can be extremely time-consuming.
- SocialEcho's comment management feature allows you to reply to comments from all platforms in one centralized interface, saving you 80% of your time.
4. Set reply priority
- High priority: Comments raising questions, negative feedback, and comments from industry experts.
- Medium priority: Comments expressing opinions, comments sharing experiences
- Low priority: Simple emojis and "agree" comments
Case Study: Successful Practices in Replying to Comments
After a B2B SaaS brand implemented a "respond to all comments within 48 hours" policy on LinkedIn:
- Participation increased from 4.2% to 6.8% (+62%).
- Average post exposure increased by 3 times
- Through interaction in the comments section, 12 high-quality sales leads were converted.
Key takeaway: Replying to comments is not "customer service," but rather part of "content strategy."
IV. Platform Differences in Content Format: One Trick Piece Is No Longer a Guarantee
If you think "video content performs best across all platforms," Buffer's data will make you rethink it.
Instagram's "Dual Personality"
Instagram is the most complex platform because it has two very different content distribution models: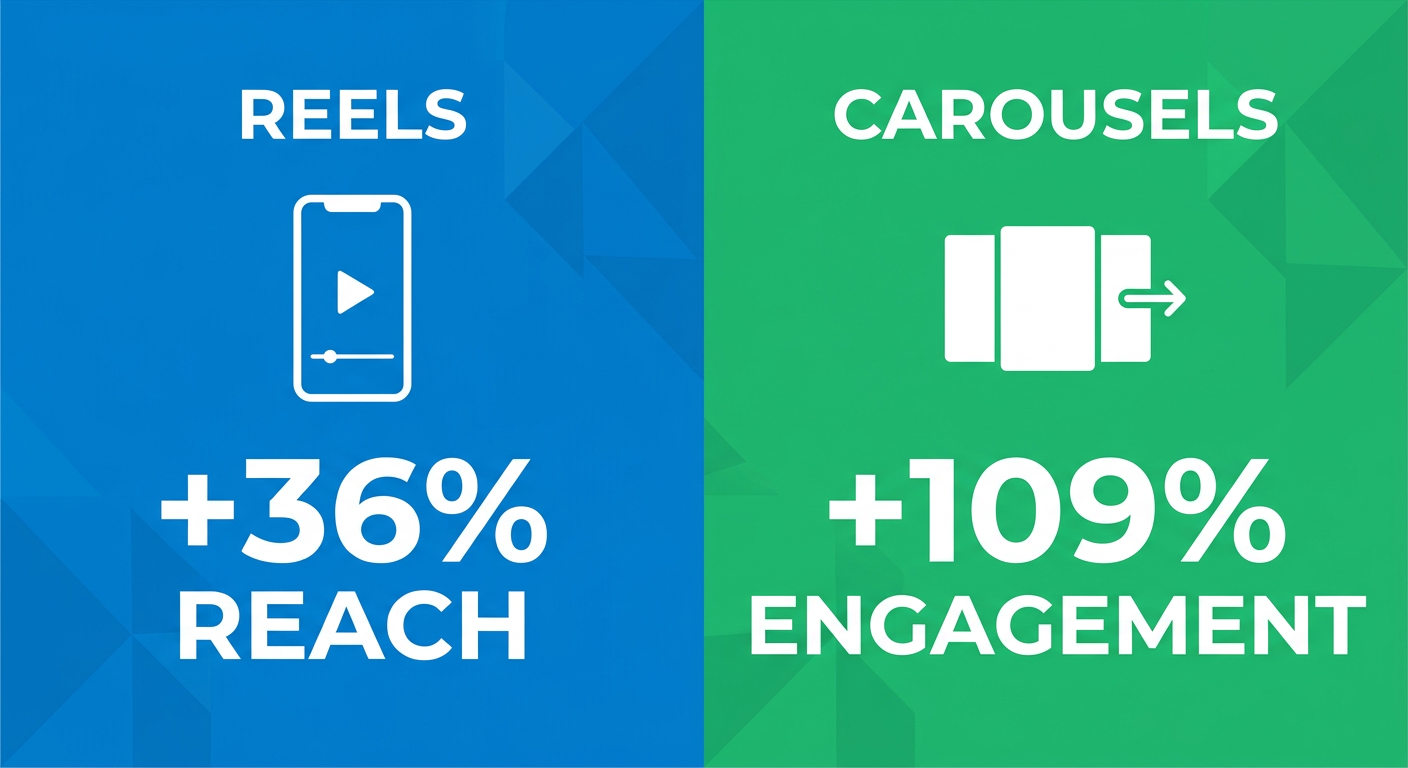
Explore mode: Reels gain exposure
- Reels received 36% more exposure than other formats.
- The algorithm will recommend Reels to users who are not fans.
- Suitable for "gaining followers" and "expanding influence".
Relationship schema (Feed): Carousel image interaction
- Carousel engagement is 109% higher than other formats.
- Fans are more willing to interact with the carousel images (swipe, like, comment).
- Suitable for "in-depth content" and "fan maintenance".
Practical suggestions:
- If your goal is to gain followers → post more Reels
- If your goal is to increase engagement → use more carousel images
- If your goal is brand awareness → Mixed use
Advantages of LinkedIn's carousel
On LinkedIn, carousels have significantly higher engagement rates: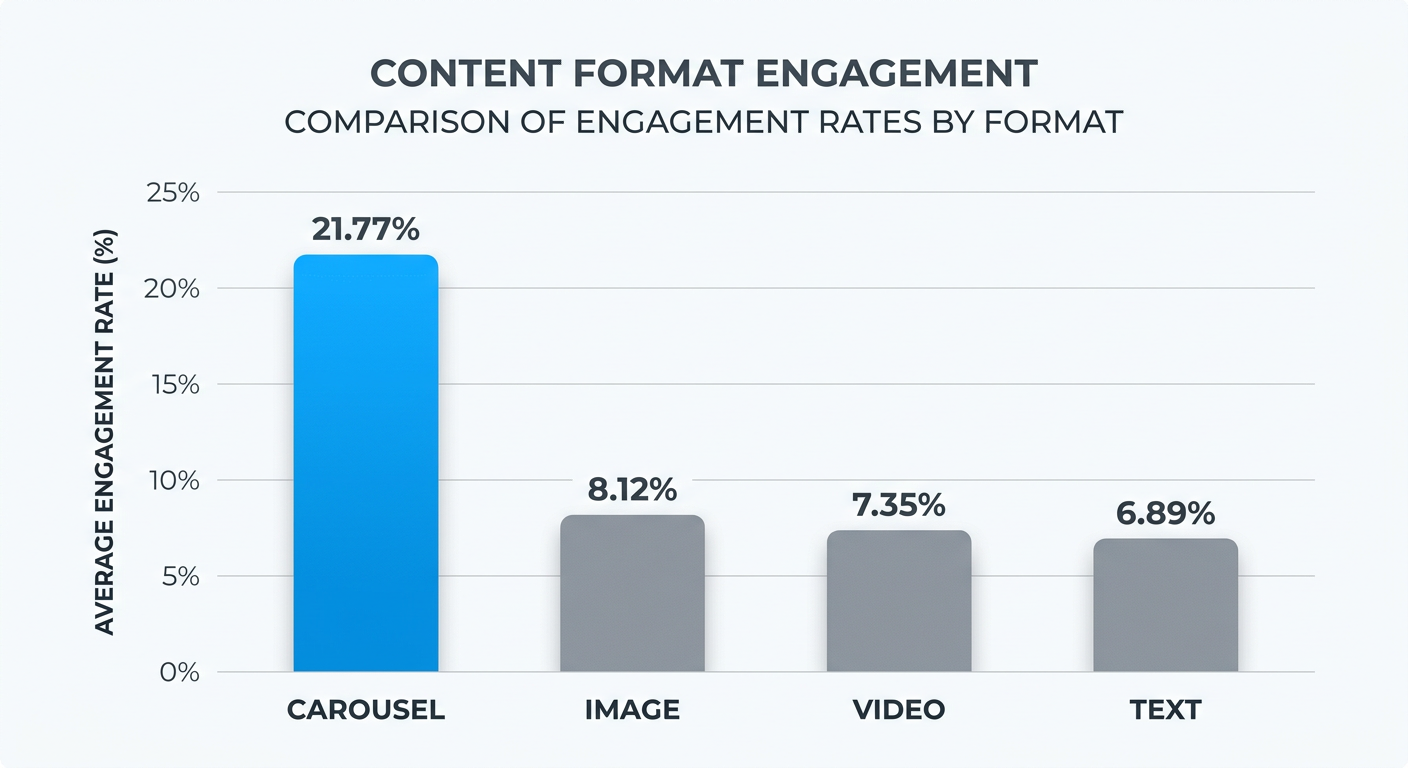
| Format | Participation |
|---|---|
| Carousel | 21.77% |
| picture | 8.12% |
| video | 7.35% |
| Plain text | 6.89% |
Why are carousels so effective on LinkedIn?
- Professional Content Adaptation - Carousels are suitable for displaying data, processes, and case studies.
- User Behavior - LinkedIn users prefer "learning" to "entertainment"
- Algorithm Preferences - LinkedIn's algorithm rewards content with longer dwell times.
Practical suggestions:
- Break the long article into a 10-page carousel.
- One key idea per page + accompanying image
- Add a CTA (such as "Follow me for more insights") on the last page.
Facebook's format neutrality
Facebook is the only platform where "format differences are not significant"—the difference in participation between different formats is less than 1 percentage point.
what does that mean?
- On Facebook, content quality is more important than content format.
- Don't force yourself to make videos just to "chase trending topics".
- Focus on creating content that is valuable to users
Formatting of TikTok, X, and Threads
- TikTok : Video is the only format, but the "first 3 seconds" decide everything.
- X : Short text + image combination performs best, video effect is average.
- Threads : Plain text posts have the highest engagement, followed by images.
Key takeaway: Don't blindly follow the trend of "video first," and choose the best format based on the characteristics of the platform.
V. Release Frequency and "Penalty for Not Releasing": Algorithms Dislike Lazy People
Buffer's data reveals a harsh truth: if you don't publish content for a week, the algorithm will "punish" you.
Data evidence of "not issuing penalties"
Buffer compared account growth rates at different posting frequencies: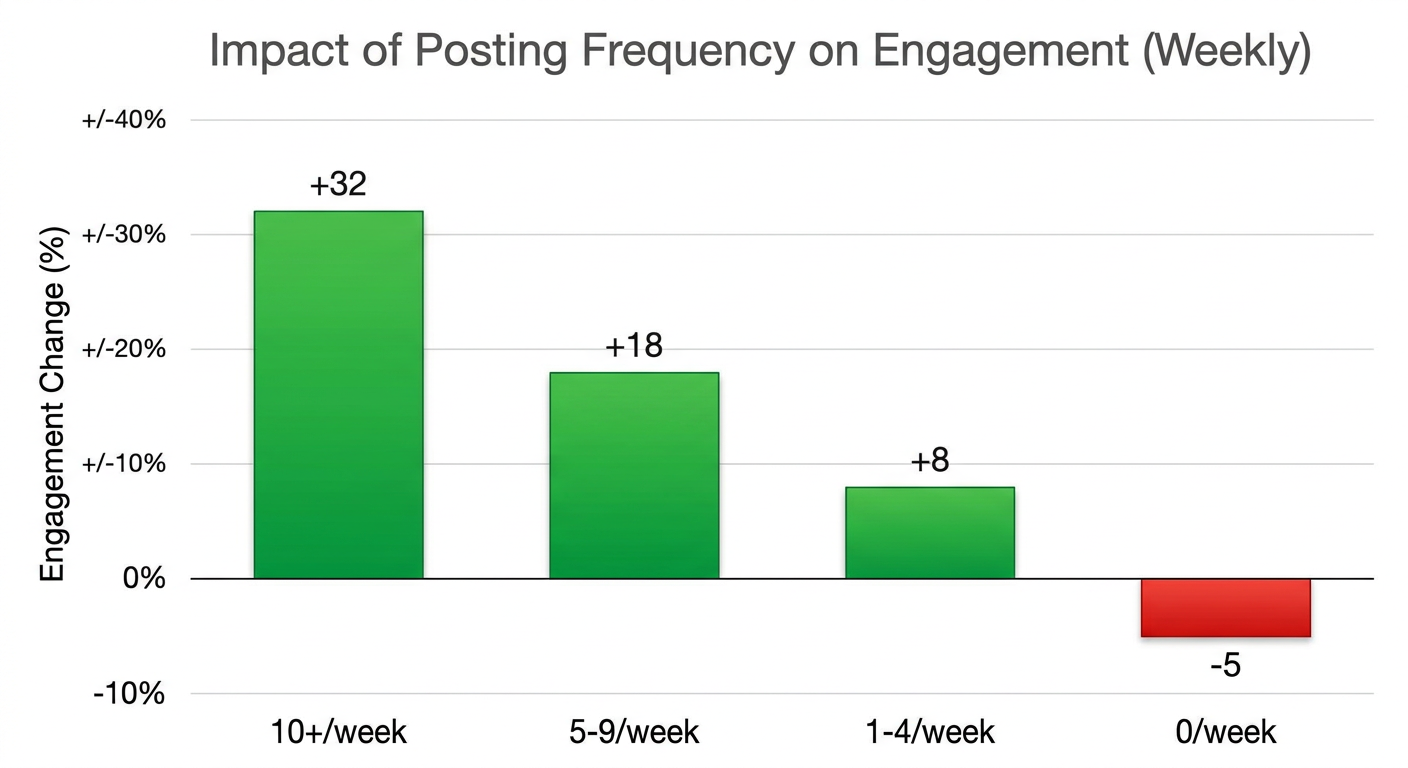
| Release frequency | New fans every week |
|---|---|
| 10+ times/week | An average of +32 followers |
| 5-9 times/week | An average of +18 followers |
| 1-4 times/week | On average, +8 fans |
| 0 times/week | Average -5 fans lost. |
Why is there a "no punishment issued"?
- Algorithm favors active accounts - the platform wants users to see "fresh content".
- User memory decay - if you don't release anything for a week, users may forget about you.
- Competitors fill the gap - if you don't post, someone else will, and user attention will be stolen.
The cost of frequent releases
While frequent posting can bring more followers, it also comes at a cost:
The average exposure of each post may decrease.
- An account posting 10+ times per week has a 15% lower exposure rate per post compared to an account posting 5-9 times per week.
- Reason: The algorithm "allocates" your exposure quota.
Content quality may decline
- Publishing low-quality content simply to meet quotas actually damages the brand image.
How do I find a posting frequency that suits me?
1. Start with the "minimum sustainable frequency"
- Don't set a goal of "3 articles a day" from the beginning.
- Start with "3 articles per week" to ensure consistency.
2. Test the effects of different frequencies.
- Month 1: 3 articles per week
- Month 2: 5 articles per week
- Month 3: 7 articles per week
- Compare engagement, follower growth, and content quality.
4. Quality > Quantity
- It's better to post three high-quality pieces of content per week than one low-quality piece of content per day.
- The "long tail effect" of high-quality content far exceeds that of low-quality content.
Key takeaway: Consistent releases are more important than high-frequency releases. Find a frequency you can maintain long-term, rather than a short-term sprint.
VI. Optimized Release Time: Window-based instead of single-point
Many people ask, "When is the best time to post?" Buffer's data provides an unexpected answer: posting time is an "optimization item," not a "determining factor."
Optimal release window for each platform
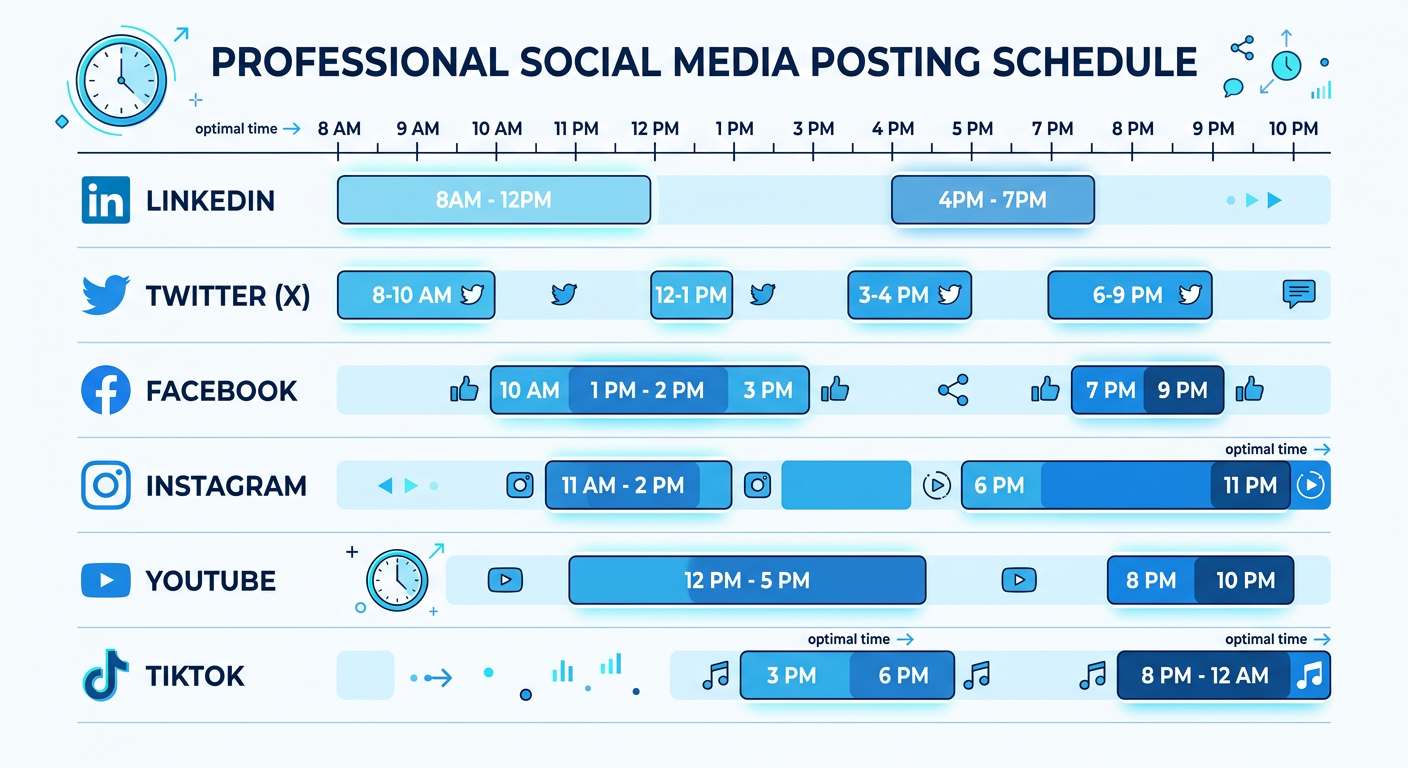
| platform | Best time window | Second best time window |
|---|---|---|
| Weekdays 8-11am | Weekdays 1-3pm | |
| Weekdays 6-9pm | Weekends 10am-1pm | |
| Weekdays 3-8pm | Weekdays 7-9am | |
| TikTok | Weekends 8-11am | Weekdays 6-9pm |
| X | Weekdays 6-11am | Weekdays 12-3pm |
| Threads | Weekdays 6-11am | Weekdays 3-6pm |
Why is time a "window" rather than a "single point"?
The buffer displays the following:
- Posts published at the "best time" saw 15-25% higher engagement than average.
- However, posts published at the "second-best time" also saw 10-18% higher engagement than the average.
- Posts published during the "worst time" saw 20-30% lower engagement than average.
what does that mean?
- The release time is indeed important, but it's not a matter of life or death.
- Instead of agonizing over whether to release at 9:00 or 9:15, focus on the quality of the content.
- Avoiding the "worst time" is more important than pursuing the "best time".
How can I test the optimal time for my account?
1. Don't blindly trust "general advice".
- Your fans may differ from the "average user".
- For example, if your followers are mainly "night owls," posting at 11 PM might be more effective.
2. Conduct A/B testing
- Choose 2-3 time periods (e.g., 9 AM, 3 PM, 8 PM).
- Publish 5-10 articles per time period.
- Comparison of participation data
3. Use intelligent scheduling tools
- Manual testing is time-consuming and prone to data omission.
- Using SocialEcho's intelligent scheduling feature, the system will automatically analyze your historical data and recommend the best time to publish.
- You can also set different publishing times based on different platforms and different content types.
Key takeaway: Release timing is a bonus, not a necessity. Focus on creating quality content first, then optimize timing.
VII. How to leverage these insights using SocialEcho
After reading Buffer's report, you might be thinking, "These insights are valuable, but how do I implement them?"
This is precisely the problem that SocialEcho aims to solve—making data-driven social media strategies simple, efficient, and sustainable.
1. Multi-platform management: One-stop management of 10+ platforms
The Buffer report covers 10 platforms, but manually managing 10 platforms is a nightmare.
- 10 different login screens
- 10 different release processes
- 10 different data reports
SocialEcho's solution:
- The multi-platform management feature allows you to manage all platforms from a single interface.
- Create once, publish on multiple platforms (automatically adapts to the format requirements of different platforms).
- A unified content calendar, clear at a glance.
2. Intelligent scheduling: Automatically releases based on the optimal time.
Buffer reports tell you "when is the best time to release," but manually releasing at the optimal time is difficult to maintain:
- You might be in a meeting at 9 a.m.
- You might be eating at 8 pm.
- You might be resting on the weekend.
SocialEcho's solution:
- The intelligent scheduling feature analyzes your historical data and automatically recommends the best release time.
- Prepare content in advance, set a publishing plan, and the system will publish automatically.
- Supports "cyclical publishing"—regularly republishing high-quality content to extend its lifespan.
3. Data Analysis: Tracking Engagement Performance
The Buffer report provides "industry benchmarks," but you need to know your own performance:
- Is your engagement level higher or lower than the baseline?
- Which content performed best?
- Which platforms are worth increasing investment in?
SocialEcho's solution:
- The data analytics feature provides detailed engagement reports.
- Comparing performance across different platforms, content types, and time periods.
- Automatically generate "optimization suggestions" (such as "Your LinkedIn carousel is performing very well; we suggest increasing the posting frequency").
4. Comment Management: Efficiently reply to comments
The Buffer report emphasizes the importance of "replying to comments," but manually replying to comments on 10 platforms is extremely time-consuming.
- You need to log in to each platform individually.
- Important comments are easily missed.
- Unable to track which comments have been replied to.
SocialEcho's solution:
- The comment management feature centralizes comments from all platforms into a single interface.
- Supports "priority marking" (such as marking "reply required", "replied", "spam comment").
- Supports "Quick Reply"—preset commonly used reply templates for one-click sending.
- Supports "content reuse"—breaking a long article into multiple shorter pieces and publishing them on different platforms.
Customer success stories
After a cross-border e-commerce brand used SocialEcho:
- Publishing efficiency improved by 300% - from 2 hours per day to 30 minutes.
- 45% increase in engagement - through smart scheduling and comment management
- Follower growth rate increased by 2 times - from +500 followers per month to +1000 followers per month.
VIII. Conclusion: Data-Driven Social Media Strategies
Buffer's 2026 Social Media Engagement Report provides us with valuable data insights, but data itself doesn't bring results—execution does.
Key takeaways (sorted by priority)
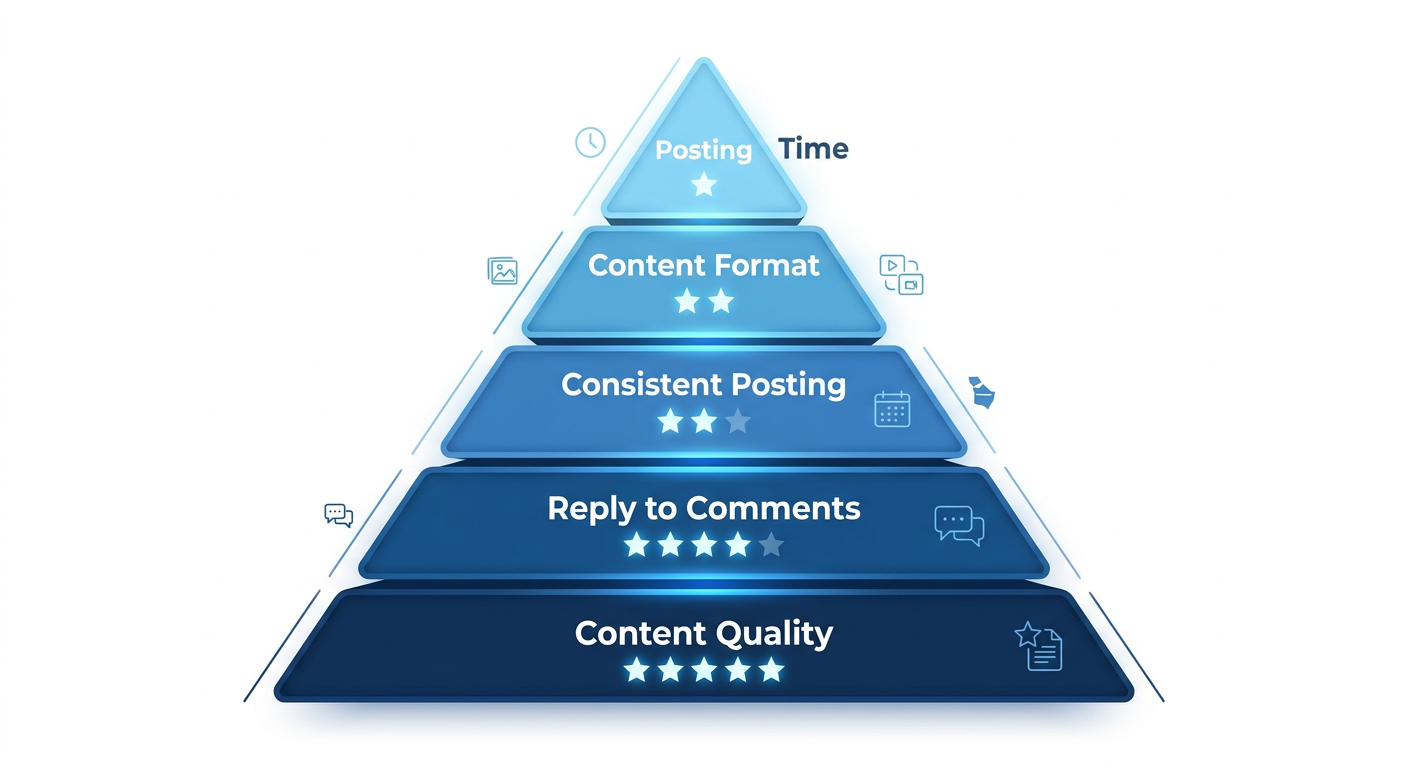
1. Content quality is the most important factor (priority: ⭐⭐⭐⭐⭐)
- Without good content, any technique is just a castle in the air.
- Focus on providing value to users (education, entertainment, inspiration).
- Quality > Quantity
2. Replying to comments is the strongest signal (priority: ⭐⭐⭐⭐⭐)
- It can increase engagement by 42% on Threads.
- It can increase engagement by 30% on LinkedIn.
- Comments from the previous 24 hours will be replied to first.
3. Continuously post to avoid penalties (Priority: ⭐⭐⭐⭐)
- The growth rate dropped significantly after a week without any updates.
- Find a frequency you can maintain long-term.
- Prepare content in advance
4. Select the format according to the platform (priority: ⭐⭐⭐)
- Instagram: Reels gaining followers, interactive carousel images
- LinkedIn: Carousel image far ahead
- Facebook: Minimal formatting differences, focus on content quality.
5. Release time is an optimization item (priority: ⭐⭐)
- Publishing during the "optimal time window" can increase engagement by 15-25%.
- However, the impact of content quality is far greater than the release time.
- Automatic optimization using intelligent scheduling tools
Action recommendations for social media operators
This week's action list:
- Record your current engagement benchmark
- Compare with the industry average in the Buffer report.
- Set improvement goals for 3 months.
- Start replying to all comments (at least within the first 24 hours).
This month's action list:
- Testing the effects of different content formats
- Testing the effects of different release times
- Build a content library and prepare content two weeks in advance.
- Assess whether tools are needed to improve efficiency.
Action list for this quarter:
- Adjust content strategy based on data
- Optimize release frequency and timing
- Establish a sustainable content production process
- Tracking ROI to prove the value of social media investment
Final words
Social media management is not "mysticism," but a science. Buffer's report, using data from over 52 million posts, tells us:
- What works (replying to comments, continuous posting, format optimization)?
- What's ineffective (blindly pursuing release time while neglecting content quality)?
- What's worth testing (best strategies for different platforms)
But data is just the starting point; execution is the end point.
If you want to turn these insights into tangible results, try SocialEcho – making data-driven social media strategies simple, efficient, and sustainable.
References:
Buffer (2026). The State of Social Media Engagement in 2026. Retrieved from https://buffer.com/resources/state-of-social-media-engagement-2026/
About SocialEcho:
SocialEcho is a one-stop social media management platform that helps brands and creators efficiently manage content across multiple platforms, increase engagement, and achieve growth goals.
;}.cls-2{fill:%230868f7;}.cls-3{fill:url(%23未命名的渐变_44);}.cls-4{fill:%23333;}%3c/style%3e%3clinearGradient%20id='未命名的渐变_8'%20x1='33.73'%20y1='100.61'%20x2='-0.03'%20y2='-1.06'%20gradientUnits='userSpaceOnUse'%3e%3cstop%20offset='0'%20stop-color='%237ae9fb'/%3e%3cstop%20offset='0.67'%20stop-color='%232b90f8'/%3e%3cstop%20offset='1'%20stop-color='%230868f7'/%3e%3c/linearGradient%3e%3clinearGradient%20id='未命名的渐变_44'%20x1='27.86'%20y1='18.67'%20x2='68.36'%20y2='22.22'%20gradientUnits='userSpaceOnUse'%3e%3cstop%20offset='0'%20stop-color='%235ac7f2'/%3e%3cstop%20offset='1'%20stop-color='%230868f7'/%3e%3c/linearGradient%3e%3c/defs%3e%3cpath%20class='cls-1'%20d='M29,28.74V81.91l-9.51-3.68v0L8.52,74A7.17,7.17,0,0,1,4,67.32V24.54A3.76,3.76,0,0,1,9.08,21Z'/%3e%3cpath%20class='cls-2'%20d='M68.09,78.07a13.15,13.15,0,0,1-17.9,12.06L29,81.91h0V28.74L50.19,37A13.17,13.17,0,0,0,68.08,25.3h0Z'/%3e%3cpath%20class='cls-3'%20d='M68.08,25.3a13.19,13.19,0,0,1-6.73,10.87A13.09,13.09,0,0,1,50.19,37L29,28.74V6A3.76,3.76,0,0,1,34.1,2.52l25.59,9.91A13.22,13.22,0,0,1,68.08,25.3Z'/%3e%3cpath%20class='cls-4'%20d='M129.06,81.76a4.33,4.33,0,0,1-3.19-1.31,4.4,4.4,0,0,1-1.31-3.24V56.86H97.65V77.21a4.36,4.36,0,0,1-1.35,3.2A4.68,4.68,0,0,1,93,81.76a4.32,4.32,0,0,1-3.19-1.31,4.37,4.37,0,0,1-1.32-3.24V27.27A4.58,4.58,0,0,1,89.83,24a4.59,4.59,0,0,1,7.82,3.27V48.15h26.91V27.27A4.58,4.58,0,0,1,125.91,24a4.59,4.59,0,0,1,7.82,3.27V77.21a4.37,4.37,0,0,1-1.36,3.2A4.65,4.65,0,0,1,129.06,81.76Z'/%3e%3cpath%20class='cls-4'%20d='M163.77,81.66c-6.57,0-11.76-1.92-15.44-5.7s-5.54-9.07-5.54-15.74a26.76,26.76,0,0,1,2.09-10.43,17.72,17.72,0,0,1,6.67-8.06,19.15,19.15,0,0,1,10.68-2.95,19,19,0,0,1,10.46,2.8,18.7,18.7,0,0,1,6.55,7.36,22.53,22.53,0,0,1,2.36,10.28A4.51,4.51,0,0,1,177,63.77H152.23a10.8,10.8,0,0,0,3.49,6.65c2,1.68,4.88,2.52,8.66,2.52a22.25,22.25,0,0,0,7.54-1.21c.74-.3,1.55-.67,2.37-1.07a3.75,3.75,0,0,1,1.84-.4,4.09,4.09,0,0,1,3,1.15,4,4,0,0,1,1.12,3,4.38,4.38,0,0,1-2.58,3.82,32.34,32.34,0,0,1-6.36,2.61A28.67,28.67,0,0,1,163.77,81.66ZM172.4,55.9a9.72,9.72,0,0,0-1.63-4.56A9.9,9.9,0,0,0,167,48a10.38,10.38,0,0,0-4.64-1.14,12,12,0,0,0-4.77,1.06,9.54,9.54,0,0,0-4.89,5.66,11.78,11.78,0,0,0-.51,2.3Z'/%3e%3cpath%20class='cls-4'%20d='M193,81.64a4.49,4.49,0,0,1-4.51-4.55V27.28A4.58,4.58,0,0,1,189.84,24a4.48,4.48,0,0,1,3.28-1.36A4.36,4.36,0,0,1,196.35,24a4.46,4.46,0,0,1,1.31,3.31V77.09a4.34,4.34,0,0,1-1.35,3.2A4.67,4.67,0,0,1,193,81.64Z'/%3e%3cpath%20class='cls-4'%20d='M263.79,81.71a5.7,5.7,0,0,1-4.2-1.74,5.76,5.76,0,0,1-1.73-4.19V27.37a4.58,4.58,0,0,1,1.35-3.27A4.59,4.59,0,0,1,267,27.37V72.53h24a4.58,4.58,0,0,1,3.27,7.82A4.66,4.66,0,0,1,291,81.71Z'/%3e%3cpath%20class='cls-4'%20d='M424.48,81.74a4.71,4.71,0,0,1-2.71-.88,5.43,5.43,0,0,1-1-1l-.07-.09-12.41-17-5.41,5v9.44a4.31,4.31,0,0,1-1.36,3.19,4.66,4.66,0,0,1-3.3,1.36A4.29,4.29,0,0,1,395,80.42a4.36,4.36,0,0,1-1.32-3.23V27.37A4.58,4.58,0,0,1,395,24.1a4.52,4.52,0,0,1,6.58.12,4.54,4.54,0,0,1,1.24,3.15V56.31l17.72-16.38.05,0a4.8,4.8,0,0,1,2.94-1.11,4.4,4.4,0,0,1,3.27,1.2,4.57,4.57,0,0,1,1.2,3.27,4.44,4.44,0,0,1-.77,2.33,7.45,7.45,0,0,1-1.43,1.65l-11,9.64,13.34,17.68a5,5,0,0,1,1,2.71,4.12,4.12,0,0,1-1.36,3.24A4.64,4.64,0,0,1,424.48,81.74Z'/%3e%3cpath%20class='cls-4'%20d='M317.93,81.76a21.5,21.5,0,1,1,21.17-21.5A21.37,21.37,0,0,1,317.93,81.76Zm0-34.1a12.61,12.61,0,1,0,12.42,12.6A12.52,12.52,0,0,0,317.93,47.66Z'/%3e%3cpath%20class='cls-4'%20d='M212.18,101.22a4.12,4.12,0,0,1-3.05-1.26,4.17,4.17,0,0,1-1.26-3.1V43.34a4.37,4.37,0,0,1,1.3-3.14,4.26,4.26,0,0,1,3.13-1.3,4.19,4.19,0,0,1,3.1,1.26,4.32,4.32,0,0,1,1.26,3.16,20.77,20.77,0,0,1,13-4.54,21.51,21.51,0,0,1,0,43,20.51,20.51,0,0,1-13-4.57V96.86a4.15,4.15,0,0,1-1.3,3.06A4.5,4.5,0,0,1,212.18,101.22Zm17.43-53.63c-6.23,0-12.93,4.11-12.93,12.72a12.73,12.73,0,0,0,25.46,0A12.71,12.71,0,0,0,229.61,47.59Z'/%3e%3cpath%20class='cls-4'%20d='M365.76,81.76a21.5,21.5,0,1,1,21.18-21.5A21.37,21.37,0,0,1,365.76,81.76Zm0-34.1a12.61,12.61,0,1,0,12.42,12.6A12.52,12.52,0,0,0,365.76,47.66Z'/%3e%3c/svg%3e)