Is pricing for third-party operations a mystery? Use these 3 types of data to get clients to willingly pay 30% more.
After each quote is given, do you ever experience this moment: the customer is silent for two seconds, then says, "Could you give me a discount? The place next door is only charging half the price."
As the manager of an agency specializing in content management, you've probably heard this hundreds of times. You know your services are worth the price, you know your team spends all day monitoring data, tracking comments, and adjusting content in the backend, and you know this workload can't be measured by "how many posts"—but clients don't know that. Clients only see the numbers on the quote and then start comparing prices.
This isn't the customer's problem; it's your problem.
To be precise, it's a visualization problem : you haven't made the value visible.
Your quote got cut, not because it was too expensive, but because you didn't make sure the client saw it.
Many third-party service providers base their pricing logic as follows: labor costs × multiplier + tool fees + profit margin = price. This formula is internally sound, but from the client's perspective, it's just a number.
Clients don't understand your workforce structure, nor do they care how many tools you use. What they care about is: what results will I get from spending this money?
When you present a quote that includes "30 content posts per month, daily interaction management, and monthly data reports," the client's brain automatically enters comparison mode. They will ask three other companies and choose the cheapest one, or use the cheapest quote to pressure you.
Is there a difference between you and that cheapest agency? Of course there is. But in the eyes of clients, you provide the same services because your pricing plans look the same—content creation, interaction, and report generation.
The essence of pricing power is not how good your service is, but whether customers can see for themselves how good it is.
This shift in perception marks a turning point for e-commerce service providers, moving them from being "compared to" to being "chosen."
Why are customers unwilling to pay a premium?
To solve this problem, we must first understand the customer's psychological mechanisms.
When clients purchase outsourced social media management services, they face an environment of high information asymmetry. They lack understanding of social media operations, cannot judge the difference between "high-quality content" and "ordinary content," and cannot estimate the actual benefits that "professional interaction management" can bring. In this situation, price becomes the only anchor point they can grasp for judgment.
The deeper reason is that the value of outsourced operations services is difficult to verify in advance . When buying a machine, you can see its specifications and samples; when hiring an employee, you can see their resume and trial performance. But when buying an outsourced operations service, you can only trust the provider's self-description—and clients implicitly discount their self-descriptions.
This explains why even if your service quality is twice as high as your competitors', your price will often only be 10-15% higher. Because customers don't perceive that difference.
There is only one solution: use data to turn the "invisible" into the "visible".
It's not about vague statements like "our service is good and the results are excellent," but rather specific, comparable data that demonstrates ROI. The following three types of data are the most compelling tools for agency services to impress clients.

Three types of data to rebuild your pricing power
Category 1: Interaction Rate Improvement Data – Quantifying Your Service Efficiency
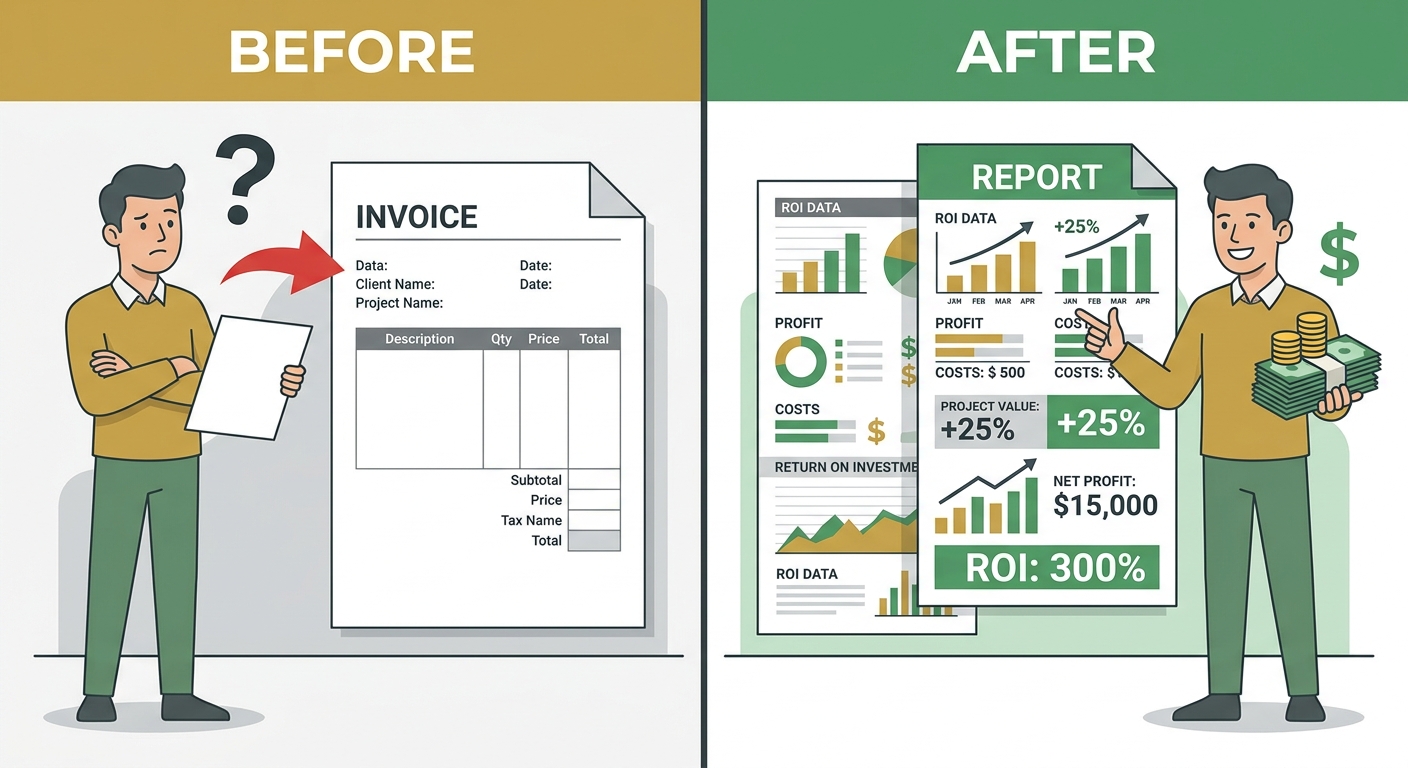
Many agency-managed content creation services send their clients a monthly report, which includes metrics like follower growth and the number of content posts, sometimes with a few screenshots. The problem with these reports is that the numbers are absolute values, leaving clients without a frame of reference to determine whether the numbers are good or bad.
What you need is visualization of process data :
Comment response speed – On average, how many minutes does your team take to respond to customer comments? How much has this speed improved compared to before you joined the company?
Comment processing volume – How many interactions were processed each month, what percentage of them were positive and guiding, and how many crisis comments were identified and blocked?
Content engagement rate trend – not the number of likes for a single post, but the engagement rate curve over three consecutive months, allowing clients to see a trajectory of continuous improvement.
Behind these data lies a powerful psychological effect: once the "diligence" of a service is quantified, customers are less likely to complain about the price . No one will complain about a service provider who can prove they are working diligently every day.
Tracking these efficiency metrics through the comment management module and exporting the numbers into charts that customers can understand is the most direct way to visualize services. When customers see "In the past 3 months, the average response time for comments on your account has decreased from 6 hours to 47 minutes, and the interaction rate has increased by 62% year-on-year," their desire to negotiate will significantly decrease.
The second category: Competitor comparison data – helping clients understand "why it's more expensive".
There is one type of data that can most effectively dissuade customers from comparing prices: data comparing your customers with those of your competitors .
When you can show customers that your competitor A posted 18 pieces of content last month with an average engagement rate of 1.2%, while your account, which we manage, posted 24 pieces of content with an average engagement rate of 3.7%, the customer's comparison framework will be completely disrupted.
He's no longer comparing your price to the agency next door; he's comparing the difference between his own account and his competitors' accounts. That difference is what he truly cares about.
The framework for a competitor comparison report can be very simple:
- Content posting frequency comparison (your client's account vs. 3-5 competitors)
- Interaction rate comparison (average interaction rate, optimal content type)
- Fan growth rate comparison
- Content theme coverage comparison (which topics competitors are covering but you haven't yet entered the market on)
Here's a key point: the comparison metrics should be those that your clients care about most, not those you think are important . If your client is a B2B company, the number of followers might not be a core metric, but the professionalism of the content and the effectiveness of inquiries generated are. For consumer brands, interaction rate and content reach are more crucial.
Competitor monitoring helps you continuously track your competitors' activities, automatically generating monthly competitor data snapshots. With this data, you're not just telling clients "we're doing well," but proving to them "your account is outperforming the competition." The latter is orders of magnitude more persuasive.
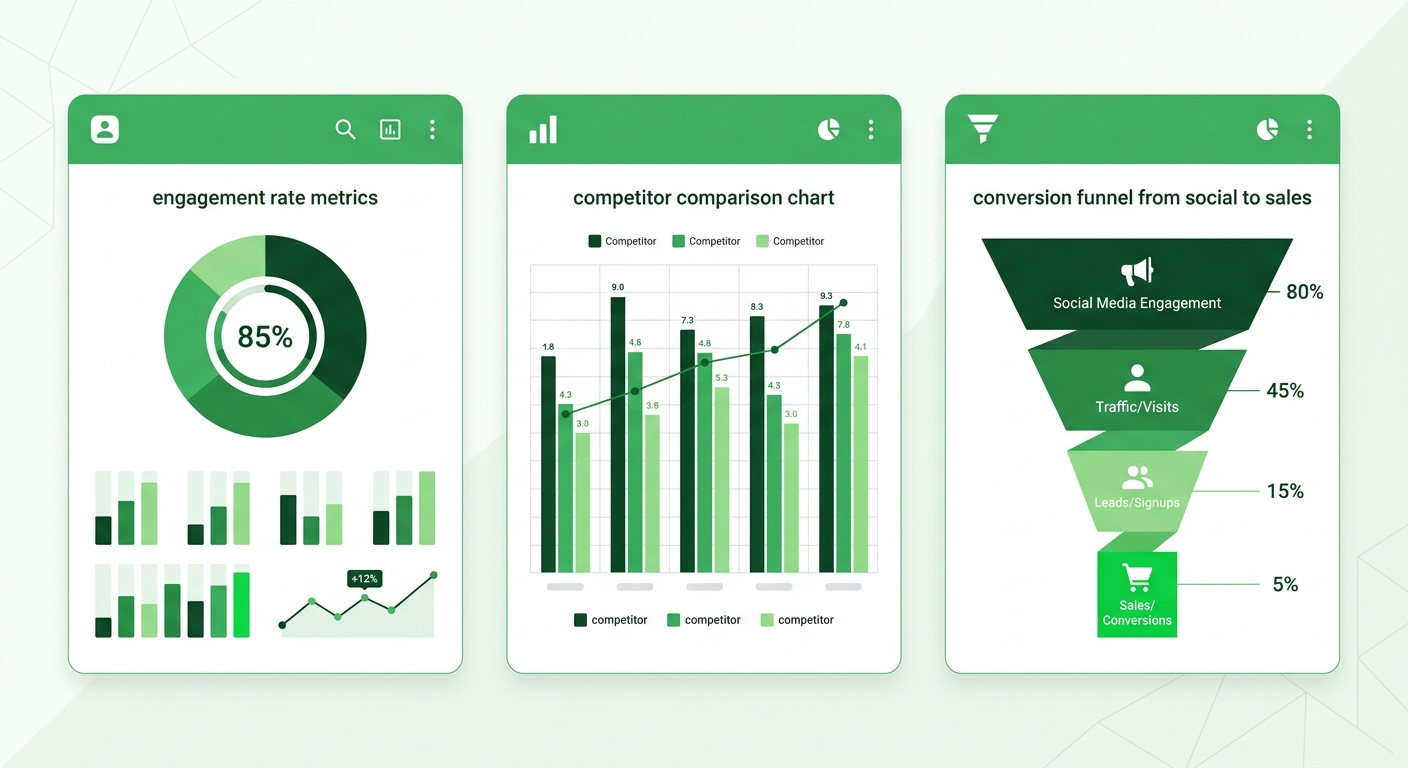
Category 3: Conversion Funnel Data – Using ROI to End All Price Disputes
The first two types of data can help customers recognize the quality of your service, but what can truly make customers "willing to pay more" is the third type: conversion funnel data .
The conversion funnel logic is: social media exposure → homepage visit → click link/fill out form → inquiry → transaction.
If you can demonstrate to clients that your social media channels generated 300 inquiries in the past quarter, with 60 resulting in sales, and an average order value of 2,000 yuan, that would generate 120,000 yuan in revenue. Meanwhile, your service fee is 8,000 yuan per month, resulting in a quarterly cost of 24,000 yuan, leading to an ROI of 500%.
Once this figure is revealed, no customer will think it's expensive.
The problem is that most third-party content creation agencies don't track this. They only focus on posting content, ignoring conversions. Clients can't see conversion data, so they can't calculate ROI and therefore can't understand the value of their service fees.
The core actions for establishing a conversion funnel tracking system are as follows: First, configure UTM parameters for each social media channel to distinguish traffic sources; second, set up inquiry forms on customer websites or landing pages to record sources; and third, issue a monthly "Social Media Channel Conversion Report" that combines traffic, inquiry, and transaction data.
Data analytics capabilities allow you to integrate traffic and interaction data from various platforms onto a single dashboard. Combined with Facebook analytics for in-depth audience analysis and customer CRM data, you can reconstruct the complete conversion path. Once this data system is established, you'll no longer have a "monthly report," but rather a "certificate of ROI."
The data report itself is a product.
One shift in thinking deserves emphasis: data reporting is not an adjunct to the service, but rather an integral part of it.
Many service providers treat data reports as "deliverables"—once the service is completed, they produce a report for the client. However, a more competitive approach is to design the report itself as a product: a clear visual presentation, a hierarchical narrative structure, and clear action recommendations for the following month.
When your reports reach this level, clients will reaffirm that their service fee was well worth it every month when they open the monthly report. Renewal will no longer be something you actively push, but a natural choice for the client.
By leveraging AI automation capabilities, most of the work involved in generating monthly reports can be automated: data scraping, chart generation, competitor snapshots, and conversion summaries are all completed systematically, significantly reducing the human resource costs of report generation while ensuring the timeliness and accuracy of the data.
SocialEcho's basic version starts at 12.5/month** (minimum 5 accounts) and includes core data analytics capabilities. The team version **starts at 18.75/month (minimum 5 accounts) and offers more comprehensive competitor monitoring and report export features. Annual subscriptions enjoy a 20% discount. For agencies managing data, this tool offers an extremely high return on investment—just one compelling data report is enough to secure a client and recoup the cost of the tool.
From Service Provider to Value Consultant
Competition in the e-commerce operations industry initially focused on creativity, then resources, and now it's all about data capabilities.
Agencies that can consistently demonstrate ROI to their clients are not just selling "outsourced operations services," but are acting as "social media growth consultants." This role shift corresponds to a completely different pricing strategy.
Customers are unwilling to pay for unseen value—that's human nature, not a problem. Your task isn't to convince customers to believe you, but to use data to show them the value firsthand.
When interaction rate trend charts, competitor comparison reports, and conversion funnel analyses are placed on the negotiating table, haggling becomes a farce. This is because clients are no longer facing a price quote, but a complete system of value propositions.
FAQ
Q1: My client is a small brand with a small amount of social media data. Can you still produce a convincing data report?
Absolutely. The persuasiveness of data doesn't come from absolute values, but from trends and comparisons. Even if your customer account only has 500 interactions per month, as long as you can demonstrate an increase in interaction rate from 0.8% to 2.3%, or that your competitors' rate is only 1.1% during the same period, the data is still powerful. The key to small data is choosing the right reference point: compare with your own historical data, compare with competitors of similar size, rather than compare with top accounts in the industry. Furthermore, for smaller brands, conversion funnel data is often more convincing—5 high-quality inquiries are more valuable to them than 500 likes. Visualizing this conversion path helps clients understand that their money is being spent effectively.
Q2: What kind of cooperation is needed from the client to establish a conversion funnel tracking system?
There are two main things the client needs to cooperate on: first, adding UTM tracking parameters to your official website or landing page (usually done by their technical staff, which can be completed within 10 minutes); second, sharing basic inquiry and transaction data once a month (detailed customer information is not required, only the quantity and approximate transaction amount). Most clients are willing to cooperate on these two points because it's valuable to them as well—they can finally see the actual return on their investment in social media channels. If a client is unwilling to cooperate, it often indicates a lack of commitment to the collaboration itself, which is a signal worth identifying in advance.
Q3: How often should competitor comparison data be updated?
We recommend updating monthly, and releasing it along with the monthly report. The value of competitor data lies in its dynamic changes, not a snapshot at a specific point in time. When clients can see the gap between their account and competitors changing each month (ideally narrowing or even surpassing the gap), this sense of dynamism significantly enhances their perception of the service's value. If a competitor suddenly gains momentum in a particular month, and you provide early warnings and response suggestions in the report, the client's trust in you will deepen further—at this point, you are no longer just a social media management service provider, but their social media strategy consultant.
Q4: Does the data report need to be created by a professional designer? Will the cost be very high?
No. For data reporting agencies, the key isn't visual appeal, but rather clear logic, accurate data, and strong operability . A well-structured PPT or PDF with clear charts is perfectly sufficient. The true determinant of report quality is the credibility of the data itself and the depth of the analysis. Using the SocialEcho platform, you can directly export formatted data reports, including interaction rate trends, competitor comparison snapshots, and conversion path analysis, essentially requiring no additional design investment. Use the time saved to interpret the data and provide action recommendations—that's what truly impresses clients.
Q5: If I've never done data tracking before, won't it be awkward to bring up data reports again with old clients?
No, on the contrary, it's a great bargaining chip for renewal negotiations. You can approach it like this: "We recently upgraded our data monitoring system. Starting next month, we'll provide you with an in-depth report that includes interaction rate trends, competitor comparisons, and conversion funnel data, helping you see the actual effects of your social media operations more clearly." Almost no client will refuse the offer of "more data." By the time the reporting system is running smoothly three months later, and you bring up the renewal price again, the basis for the negotiation will be completely different. This is also one of the best ways to raise prices for existing clients.
Q6: How to integrate data from different platforms into a single report? What if the data definitions are inconsistent?
This is a real pain point for many agency management services. Instagram's "engagement rate" and Facebook's "engagement rate" are calculated differently, and LinkedIn's engagement logic is completely different. The solution is to present raw data separately by platform in the report, but use a unified business metric (such as "total inquiries this month" or "follower growth rate") for cross-platform aggregation. This maintains data accuracy while providing clients with a clear overall understanding. SocialEcho supports unified collection and analysis of data from multiple platforms, which can significantly reduce the time cost of manually compiling data from different platforms, allowing agencies to focus more on report interpretation and recommendations.
Q7: What should I do if the client still thinks it's expensive after reviewing the data report?
If the data is already convincing enough, but the client is still haggling, there are usually two possibilities: First, the client's budget is limited. In this case, you can discuss adjusting the scope of services rather than lowering the price—for example, reducing the number of platforms or adjusting the content posting frequency. Second, the client's sensitivity to a certain type of data is lower than you expected. In this case, you need to re-identify what their most important KPIs are and adjust the focus of the report accordingly. In either case, the basic principle is not to compromise on price, but to find room for negotiation on the service structure . Once you set a precedent of "even good data can be used to negotiate a lower price," your bargaining power will continue to suffer. Maintaining the dignity of your quote is a fundamental prerequisite for pricing power.
;}.cls-2{fill:%230868f7;}.cls-3{fill:url(%23未命名的渐变_44);}.cls-4{fill:%23333;}%3c/style%3e%3clinearGradient%20id='未命名的渐变_8'%20x1='33.73'%20y1='100.61'%20x2='-0.03'%20y2='-1.06'%20gradientUnits='userSpaceOnUse'%3e%3cstop%20offset='0'%20stop-color='%237ae9fb'/%3e%3cstop%20offset='0.67'%20stop-color='%232b90f8'/%3e%3cstop%20offset='1'%20stop-color='%230868f7'/%3e%3c/linearGradient%3e%3clinearGradient%20id='未命名的渐变_44'%20x1='27.86'%20y1='18.67'%20x2='68.36'%20y2='22.22'%20gradientUnits='userSpaceOnUse'%3e%3cstop%20offset='0'%20stop-color='%235ac7f2'/%3e%3cstop%20offset='1'%20stop-color='%230868f7'/%3e%3c/linearGradient%3e%3c/defs%3e%3cpath%20class='cls-1'%20d='M29,28.74V81.91l-9.51-3.68v0L8.52,74A7.17,7.17,0,0,1,4,67.32V24.54A3.76,3.76,0,0,1,9.08,21Z'/%3e%3cpath%20class='cls-2'%20d='M68.09,78.07a13.15,13.15,0,0,1-17.9,12.06L29,81.91h0V28.74L50.19,37A13.17,13.17,0,0,0,68.08,25.3h0Z'/%3e%3cpath%20class='cls-3'%20d='M68.08,25.3a13.19,13.19,0,0,1-6.73,10.87A13.09,13.09,0,0,1,50.19,37L29,28.74V6A3.76,3.76,0,0,1,34.1,2.52l25.59,9.91A13.22,13.22,0,0,1,68.08,25.3Z'/%3e%3cpath%20class='cls-4'%20d='M129.06,81.76a4.33,4.33,0,0,1-3.19-1.31,4.4,4.4,0,0,1-1.31-3.24V56.86H97.65V77.21a4.36,4.36,0,0,1-1.35,3.2A4.68,4.68,0,0,1,93,81.76a4.32,4.32,0,0,1-3.19-1.31,4.37,4.37,0,0,1-1.32-3.24V27.27A4.58,4.58,0,0,1,89.83,24a4.59,4.59,0,0,1,7.82,3.27V48.15h26.91V27.27A4.58,4.58,0,0,1,125.91,24a4.59,4.59,0,0,1,7.82,3.27V77.21a4.37,4.37,0,0,1-1.36,3.2A4.65,4.65,0,0,1,129.06,81.76Z'/%3e%3cpath%20class='cls-4'%20d='M163.77,81.66c-6.57,0-11.76-1.92-15.44-5.7s-5.54-9.07-5.54-15.74a26.76,26.76,0,0,1,2.09-10.43,17.72,17.72,0,0,1,6.67-8.06,19.15,19.15,0,0,1,10.68-2.95,19,19,0,0,1,10.46,2.8,18.7,18.7,0,0,1,6.55,7.36,22.53,22.53,0,0,1,2.36,10.28A4.51,4.51,0,0,1,177,63.77H152.23a10.8,10.8,0,0,0,3.49,6.65c2,1.68,4.88,2.52,8.66,2.52a22.25,22.25,0,0,0,7.54-1.21c.74-.3,1.55-.67,2.37-1.07a3.75,3.75,0,0,1,1.84-.4,4.09,4.09,0,0,1,3,1.15,4,4,0,0,1,1.12,3,4.38,4.38,0,0,1-2.58,3.82,32.34,32.34,0,0,1-6.36,2.61A28.67,28.67,0,0,1,163.77,81.66ZM172.4,55.9a9.72,9.72,0,0,0-1.63-4.56A9.9,9.9,0,0,0,167,48a10.38,10.38,0,0,0-4.64-1.14,12,12,0,0,0-4.77,1.06,9.54,9.54,0,0,0-4.89,5.66,11.78,11.78,0,0,0-.51,2.3Z'/%3e%3cpath%20class='cls-4'%20d='M193,81.64a4.49,4.49,0,0,1-4.51-4.55V27.28A4.58,4.58,0,0,1,189.84,24a4.48,4.48,0,0,1,3.28-1.36A4.36,4.36,0,0,1,196.35,24a4.46,4.46,0,0,1,1.31,3.31V77.09a4.34,4.34,0,0,1-1.35,3.2A4.67,4.67,0,0,1,193,81.64Z'/%3e%3cpath%20class='cls-4'%20d='M263.79,81.71a5.7,5.7,0,0,1-4.2-1.74,5.76,5.76,0,0,1-1.73-4.19V27.37a4.58,4.58,0,0,1,1.35-3.27A4.59,4.59,0,0,1,267,27.37V72.53h24a4.58,4.58,0,0,1,3.27,7.82A4.66,4.66,0,0,1,291,81.71Z'/%3e%3cpath%20class='cls-4'%20d='M424.48,81.74a4.71,4.71,0,0,1-2.71-.88,5.43,5.43,0,0,1-1-1l-.07-.09-12.41-17-5.41,5v9.44a4.31,4.31,0,0,1-1.36,3.19,4.66,4.66,0,0,1-3.3,1.36A4.29,4.29,0,0,1,395,80.42a4.36,4.36,0,0,1-1.32-3.23V27.37A4.58,4.58,0,0,1,395,24.1a4.52,4.52,0,0,1,6.58.12,4.54,4.54,0,0,1,1.24,3.15V56.31l17.72-16.38.05,0a4.8,4.8,0,0,1,2.94-1.11,4.4,4.4,0,0,1,3.27,1.2,4.57,4.57,0,0,1,1.2,3.27,4.44,4.44,0,0,1-.77,2.33,7.45,7.45,0,0,1-1.43,1.65l-11,9.64,13.34,17.68a5,5,0,0,1,1,2.71,4.12,4.12,0,0,1-1.36,3.24A4.64,4.64,0,0,1,424.48,81.74Z'/%3e%3cpath%20class='cls-4'%20d='M317.93,81.76a21.5,21.5,0,1,1,21.17-21.5A21.37,21.37,0,0,1,317.93,81.76Zm0-34.1a12.61,12.61,0,1,0,12.42,12.6A12.52,12.52,0,0,0,317.93,47.66Z'/%3e%3cpath%20class='cls-4'%20d='M212.18,101.22a4.12,4.12,0,0,1-3.05-1.26,4.17,4.17,0,0,1-1.26-3.1V43.34a4.37,4.37,0,0,1,1.3-3.14,4.26,4.26,0,0,1,3.13-1.3,4.19,4.19,0,0,1,3.1,1.26,4.32,4.32,0,0,1,1.26,3.16,20.77,20.77,0,0,1,13-4.54,21.51,21.51,0,0,1,0,43,20.51,20.51,0,0,1-13-4.57V96.86a4.15,4.15,0,0,1-1.3,3.06A4.5,4.5,0,0,1,212.18,101.22Zm17.43-53.63c-6.23,0-12.93,4.11-12.93,12.72a12.73,12.73,0,0,0,25.46,0A12.71,12.71,0,0,0,229.61,47.59Z'/%3e%3cpath%20class='cls-4'%20d='M365.76,81.76a21.5,21.5,0,1,1,21.18-21.5A21.37,21.37,0,0,1,365.76,81.76Zm0-34.1a12.61,12.61,0,1,0,12.42,12.6A12.52,12.52,0,0,0,365.76,47.66Z'/%3e%3c/svg%3e)