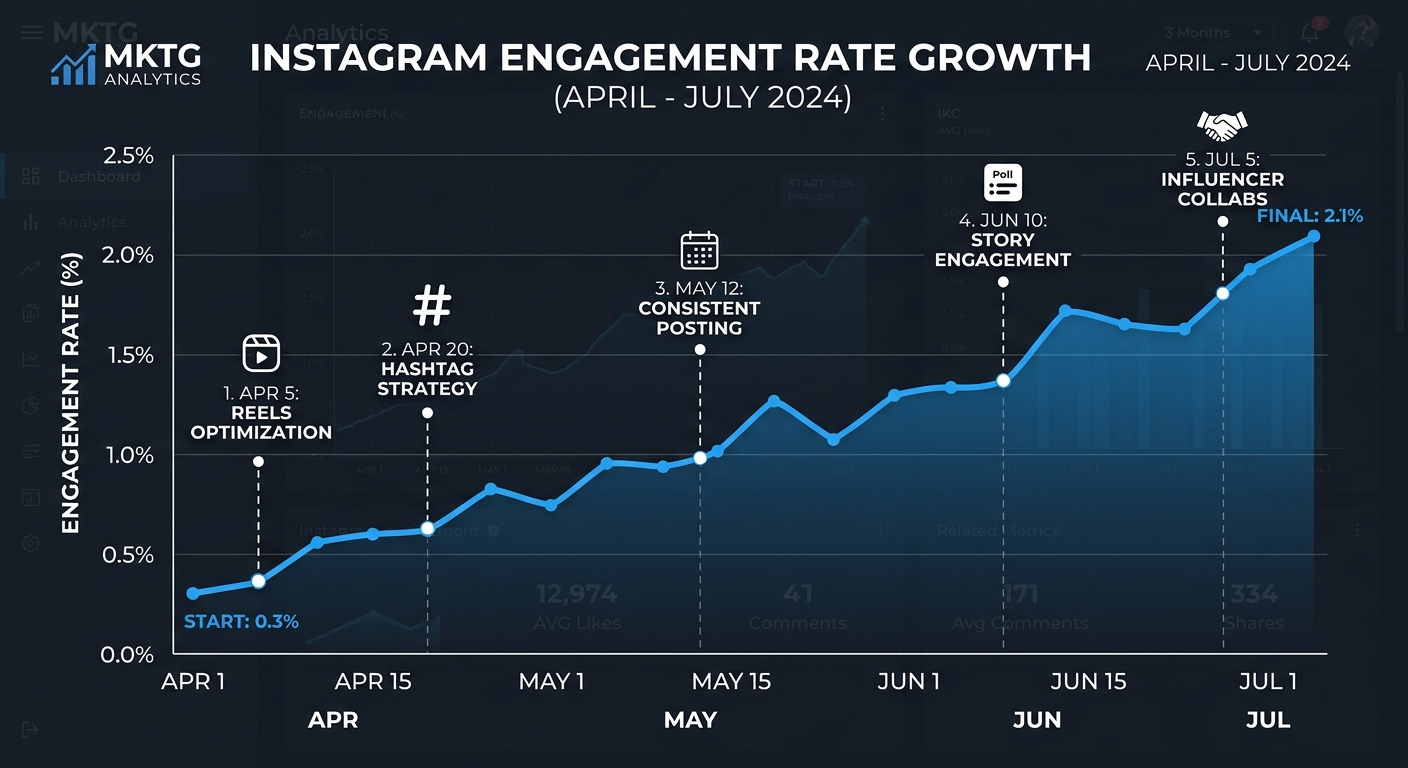
How a brand expanding overseas increased its Instagram engagement rate from 0.3% to 2.1% in 3 months.
Manager Chen stared at the data on the screen, his expression somewhat grim. This home furnishing brand, which exports its products overseas, had been running its Instagram account for eight months, growing its followers from zero to 32,000, but its engagement rate had been hovering around 0.3%. By industry standards, a rate above 1% is considered passing, and their figure was almost only a third of the passing mark.
The boss asked: We've spent so much money on KOL collaborations and so many ads, why does this account look like it's dead?
This issue highlights a key pain point for many brands going global: they have followers and posts, but there's a lack of genuine interaction and engagement.
What does an interaction rate of 0.3% mean?
First, understand the meaning of the numbers. The general formula for calculating Instagram engagement rate:
Interaction rate = (Likes + Comments + Shares + Saves) / Post impressions × 100%
0.3% means that less than one in 100 people who see the content will interact with it in any way. Such accounts are considered "low-quality content" by Instagram's algorithm and will be further suppressed and distributed—creating a vicious cycle.
Industry benchmark data shows:
- Home furnishing/decoration brands : Average interaction rate 1.2%-2.8%
- Apparel brands : Average interaction rate 1.5%-3.5%
- Beauty brands : Average interaction rate 2.0%-4.5%
- Technology/3C brands : Average interaction rate 0.8%-1.5%
This home furnishing brand's 0.3% is already far below the industry average.
Problem Diagnosis: Why is the interaction rate so low?
The team spent two weeks conducting in-depth diagnostics and identified three core issues:
Problem 1: The content is not localized enough and is out of touch with the target audience.
The account posts mostly product photos with translated Chinese text, using Google Translate to create a stiff and unnatural feel. Users feel like they're dealing with a "stranger trying to sell something," with no emotional connection whatsoever.
Question 2: The release time is completely wrong.
The account was previously posting based on Beijing time, which corresponds to 2-3 AM for the US audience. This means that the target users were asleep when the content was posted, completely wasting the golden interaction period.
Question 3: Without interactive guidance, the comment section is practically useless.
After the post was published, no one replied to the comments, and the comment section fell silent. Users saw that other people's questions were not being answered, so they were even less willing to speak up.
Three months of systemic reform
First month: Content strategy rebuilding
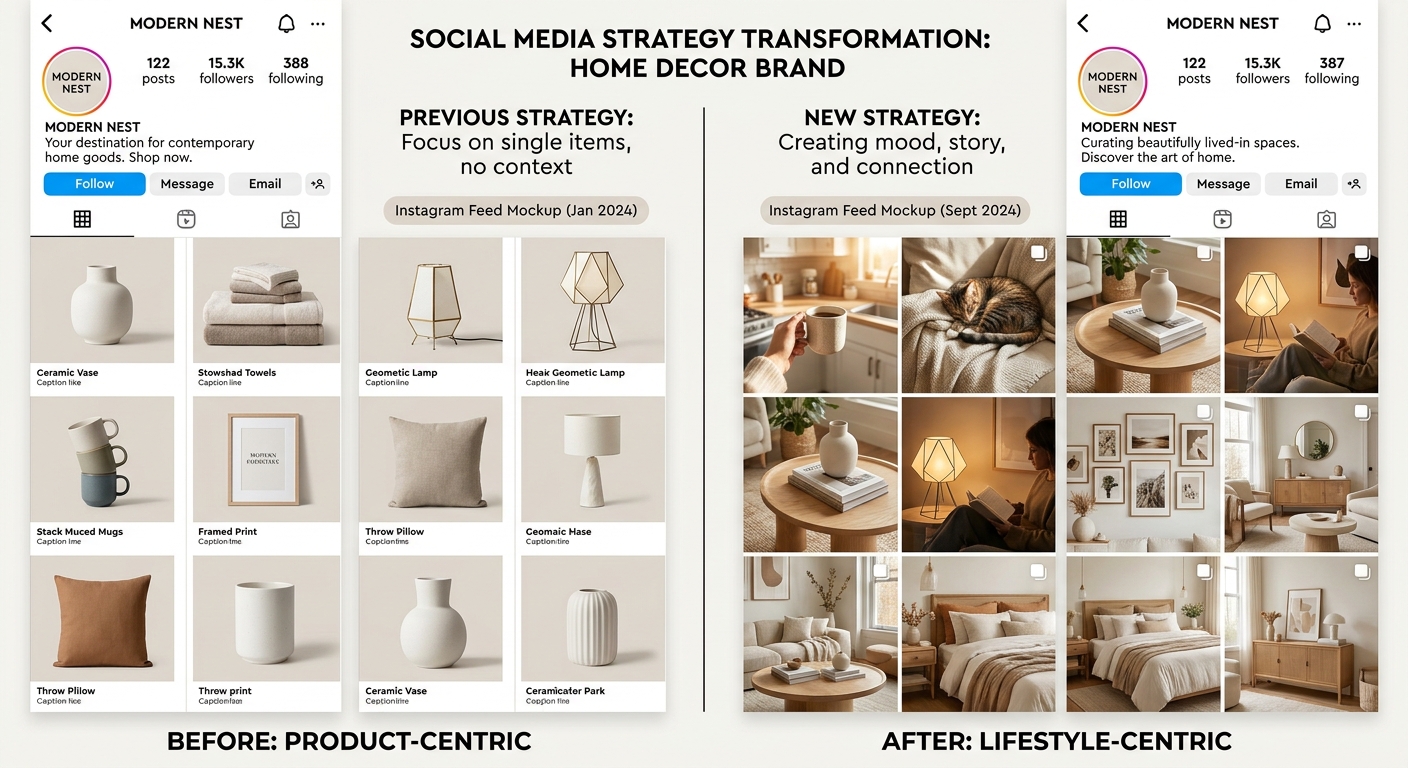
Adjustment 1: From "Product Photos" to "Lifestyle Scenes"
Stop posting simple white background images of the product; instead, place the product in real home settings. Use a UGC strategy: contact existing North American customers and invite them to share photos of their usage scenarios, using "featured showcases + free products" as an incentive.
After the first batch of UGC content was released, the interaction rate jumped to 1.1% because it was real users' real homes, which made other users feel a sense of identification.
Adjustment 2: Copywriting Redesign
Abandoning the translated style, we switched to authentic English expressions. The copywriting structure was changed from "product introduction" to "life pain points + relatable scenarios + solutions".
For example, the original copy read: "Our sofa is made of high-quality leather, durable and comfortable."
Change to: "Sunday mornings are for this. ☁️ Tag someone you'd spend a slow morning with."
The former received 0 comments, while the latter received over 80 comments and tags.
Adjustment 3: Optimization of release time
By analyzing audience activity times using data analytics tools, it was found that North American audiences are most active during the following periods:
- Weekdays: 7-9 AM (commuting time), 8-11 PM (using my phone before bed)
- Weekends: 9-11 am and 2-4 pm
By switching the posting time entirely to these windows, this single change increased the exposure of individual posts by 35%.
Second month: Deepening interaction
Strategy 1: Establish a 24-hour comment reply mechanism
All comments must be responded to within 24 hours. The key is to provide warm and personalized replies, rather than perfunctory responses like "Thanks!"
For repetitive, standard questions (such as "How long does shipping take?"), we use Instagram's comment management tools to configure automated response templates to ensure timely responses. High-value interactions (comments with purchase intent, in-depth questions) are answered manually and carefully.
This change revitalized the comment section, making other users more willing to join in when they saw real conversations under the posts.
Strategy Two: Stories Interactive Design
Post at least 3 Stories per week, consistently using the "Poll" and "Question" stickers:
- Monday's "Multiple Choice Question": Which of these two colors do you prefer? (A/B voting)
- Wednesday's "Ask Me Anything": What questions do you have about home decorating?
- Friday's "Guess What": What new products will we be launching next week?
Stories interactions do not count towards post interaction rate, but they do boost overall account activity signals and indirectly affect post distribution priority.
Strategy 3: Incorporate Reels into core content
Instagram's algorithm gave Reels significantly higher traffic weight during this period. The team started producing two Reels per week, mainly in the form of "30-second before and after home renovation comparison" and "3 home improvement tips you didn't know".
Reels has an average engagement rate 2.3 times that of regular text and image posts.
Month 3: Data-Driven Optimization
Weekly data review meeting
Establish a fixed weekly review mechanism, focusing on three key indicators:
- Interaction rate (compared by content type)
- Save rate (user saving posts is a high-intent behavior and deserves special tracking).
- Review quality score (judged by review length and whether it includes product information)
By using the competitor monitoring function, we can track the content performance of similar competitors, discover what content formats they are testing, and adjust our strategy accordingly.
A/B test script
On the same theme, two different copywriting styles were tested: emotionally resonant vs. practically informative. Data showed that the audience of this account had a 42% higher interaction rate with the "emotionally resonant" copywriting, which solidified the direction of content creation.
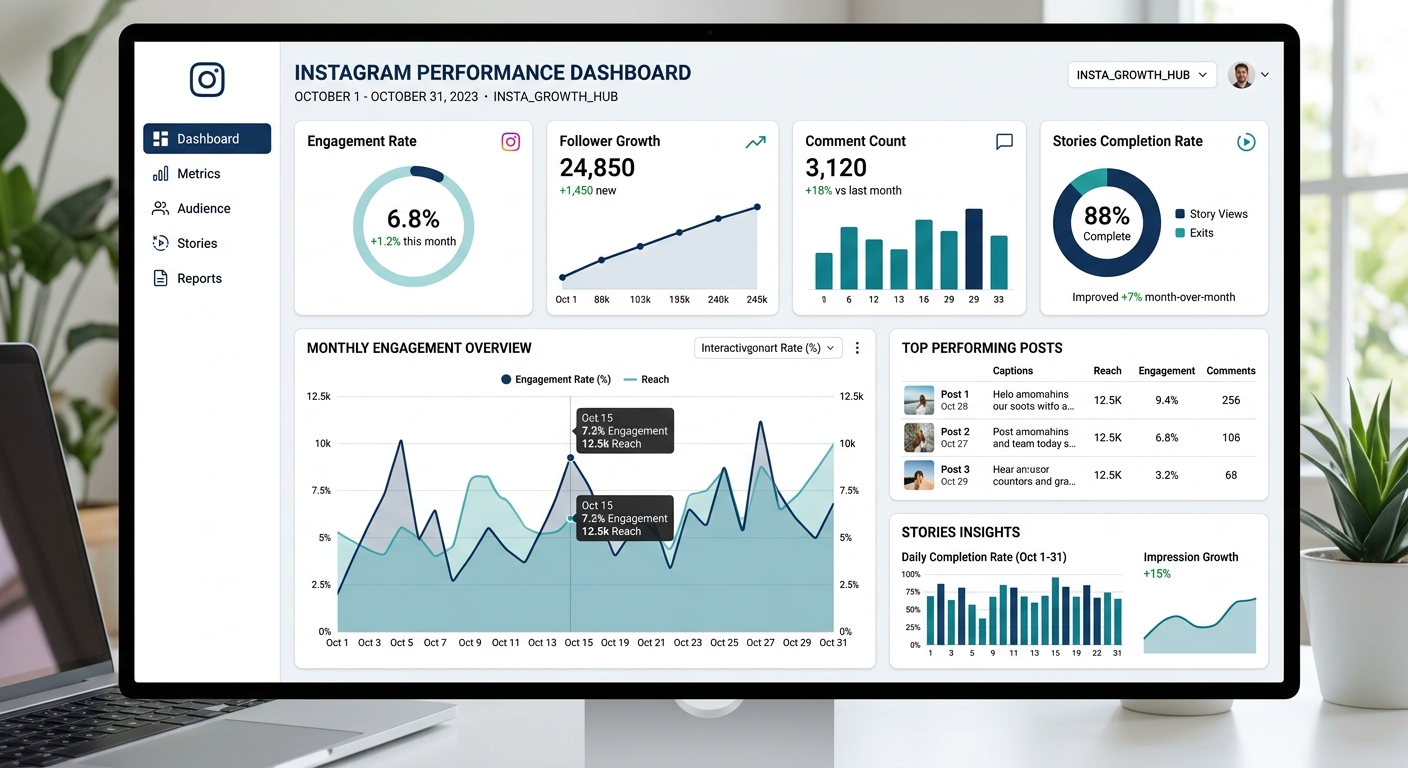
Results three months later
| index | Before renovation | After renovation |
|---|---|---|
| Interaction rate | 0.3% | 2.1% |
| Average number of comments per post | 3 | 28 articles |
| fan growth rate | 1200 people/month | 4800 people/month |
| Stories completion rate | 18% | 47% |
| Organic traffic purchase conversion | Negligible | 45 new transactions per month |
The interaction rate increased from 0.3% to 2.1%, a growth of 600%, and this figure has exceeded the industry average for the same product category.
Key Experience Summary
1. Low interaction rates are rarely a problem of "poor fan quality," but rather a problem of content strategy and operational pace.
2. "Localization" of copywriting is more important than "accurate translation." You need to speak in the way that your target audience uses.
3. Release time is the most easily overlooked but fastest-changing variable and deserves priority adjustment.
4. The activity level in the comment section is self-reinforcing —only when someone replies to a comment will others dare to speak; if the comment section is dead, no one wants to be the first.
5. Save rate is a more valuable signal than likes , indicating that the content is useful and worth revisiting.
FAQ
Q1: What is a good interaction rate?
Interaction rates vary significantly across different industries and account sizes. Generally, the more followers an account has, the lower its engagement rate (larger accounts have more dispersed traffic). A healthy range is 1%-3%, above 3% is excellent, and above 5% is top-tier content. Smaller accounts with fewer than 10,000 followers can have higher engagement rates, with 5%-10% being normal.
Q2: Should I prioritize increasing likes or comments?
Prioritize comments. Instagram's algorithm weighs comments higher than likes because comments represent deeper engagement. Posts with comments are recommended to more people, creating a positive feedback loop.
Q3: Will using an auto-reply tool reduce the quality of interaction?
The key lies in the use case. Automated replies are perfectly reasonable for standardized inquiries, freeing up manpower to focus on high-value interactions. However, genuine opinions and emotional comments must be responded to manually, not using templates. SocialEcho's Instagram comment auto-replies support keyword categorization, accurately distinguishing which comments are processed automatically and which are queued by human reviewers.
Q4: Is there a relationship between KOL collaborations and interaction rates?
KOL collaborations primarily impact exposure and new follower growth, but if newly acquired followers aren't part of your target audience, they can lower engagement rates. When selecting KOLs, audience fit is more important than follower count—do their followers overlap with your target customer group?
Q5: With so many optimizations made, will they be sustainable? Or will they decline?
Sustainability. The key is to turn good strategies into standardized processes: templated content, fixed release schedules, and tool-based interaction management. When these become a system, interaction rates no longer depend on personal inspiration, but on the output of the process.
Q6: What recent changes have been made to Instagram's algorithm that we should be aware of?
Instagram currently gives more weight to the following content: Reels (short videos), location-tagged content, content using popular music, highly saved content, and cross-account interactions (mutual comments). It's recommended to use Reels as your primary content type, not just as a supplement.
Q7: What is the biggest difference between overseas brands and domestic brands in their Instagram operations?
Cultural understanding is the biggest gap. The "high-density text + product feature listing" approach that domestic brands are accustomed to using works poorly overseas. Overseas users respond more to emotional narratives, lifestyle resonance, and a sense of community. In addition, the tone of comments and interactions is also very important—it should sound like a conversation with a friend, not an official brand statement.
Want to systematically analyze your Instagram account's engagement data? Instagram competitor analysis can help you compare the performance of similar accounts and identify gaps and opportunities.
;}.cls-2{fill:%230868f7;}.cls-3{fill:url(%23未命名的渐变_44);}.cls-4{fill:%23333;}%3c/style%3e%3clinearGradient%20id='未命名的渐变_8'%20x1='33.73'%20y1='100.61'%20x2='-0.03'%20y2='-1.06'%20gradientUnits='userSpaceOnUse'%3e%3cstop%20offset='0'%20stop-color='%237ae9fb'/%3e%3cstop%20offset='0.67'%20stop-color='%232b90f8'/%3e%3cstop%20offset='1'%20stop-color='%230868f7'/%3e%3c/linearGradient%3e%3clinearGradient%20id='未命名的渐变_44'%20x1='27.86'%20y1='18.67'%20x2='68.36'%20y2='22.22'%20gradientUnits='userSpaceOnUse'%3e%3cstop%20offset='0'%20stop-color='%235ac7f2'/%3e%3cstop%20offset='1'%20stop-color='%230868f7'/%3e%3c/linearGradient%3e%3c/defs%3e%3cpath%20class='cls-1'%20d='M29,28.74V81.91l-9.51-3.68v0L8.52,74A7.17,7.17,0,0,1,4,67.32V24.54A3.76,3.76,0,0,1,9.08,21Z'/%3e%3cpath%20class='cls-2'%20d='M68.09,78.07a13.15,13.15,0,0,1-17.9,12.06L29,81.91h0V28.74L50.19,37A13.17,13.17,0,0,0,68.08,25.3h0Z'/%3e%3cpath%20class='cls-3'%20d='M68.08,25.3a13.19,13.19,0,0,1-6.73,10.87A13.09,13.09,0,0,1,50.19,37L29,28.74V6A3.76,3.76,0,0,1,34.1,2.52l25.59,9.91A13.22,13.22,0,0,1,68.08,25.3Z'/%3e%3cpath%20class='cls-4'%20d='M129.06,81.76a4.33,4.33,0,0,1-3.19-1.31,4.4,4.4,0,0,1-1.31-3.24V56.86H97.65V77.21a4.36,4.36,0,0,1-1.35,3.2A4.68,4.68,0,0,1,93,81.76a4.32,4.32,0,0,1-3.19-1.31,4.37,4.37,0,0,1-1.32-3.24V27.27A4.58,4.58,0,0,1,89.83,24a4.59,4.59,0,0,1,7.82,3.27V48.15h26.91V27.27A4.58,4.58,0,0,1,125.91,24a4.59,4.59,0,0,1,7.82,3.27V77.21a4.37,4.37,0,0,1-1.36,3.2A4.65,4.65,0,0,1,129.06,81.76Z'/%3e%3cpath%20class='cls-4'%20d='M163.77,81.66c-6.57,0-11.76-1.92-15.44-5.7s-5.54-9.07-5.54-15.74a26.76,26.76,0,0,1,2.09-10.43,17.72,17.72,0,0,1,6.67-8.06,19.15,19.15,0,0,1,10.68-2.95,19,19,0,0,1,10.46,2.8,18.7,18.7,0,0,1,6.55,7.36,22.53,22.53,0,0,1,2.36,10.28A4.51,4.51,0,0,1,177,63.77H152.23a10.8,10.8,0,0,0,3.49,6.65c2,1.68,4.88,2.52,8.66,2.52a22.25,22.25,0,0,0,7.54-1.21c.74-.3,1.55-.67,2.37-1.07a3.75,3.75,0,0,1,1.84-.4,4.09,4.09,0,0,1,3,1.15,4,4,0,0,1,1.12,3,4.38,4.38,0,0,1-2.58,3.82,32.34,32.34,0,0,1-6.36,2.61A28.67,28.67,0,0,1,163.77,81.66ZM172.4,55.9a9.72,9.72,0,0,0-1.63-4.56A9.9,9.9,0,0,0,167,48a10.38,10.38,0,0,0-4.64-1.14,12,12,0,0,0-4.77,1.06,9.54,9.54,0,0,0-4.89,5.66,11.78,11.78,0,0,0-.51,2.3Z'/%3e%3cpath%20class='cls-4'%20d='M193,81.64a4.49,4.49,0,0,1-4.51-4.55V27.28A4.58,4.58,0,0,1,189.84,24a4.48,4.48,0,0,1,3.28-1.36A4.36,4.36,0,0,1,196.35,24a4.46,4.46,0,0,1,1.31,3.31V77.09a4.34,4.34,0,0,1-1.35,3.2A4.67,4.67,0,0,1,193,81.64Z'/%3e%3cpath%20class='cls-4'%20d='M263.79,81.71a5.7,5.7,0,0,1-4.2-1.74,5.76,5.76,0,0,1-1.73-4.19V27.37a4.58,4.58,0,0,1,1.35-3.27A4.59,4.59,0,0,1,267,27.37V72.53h24a4.58,4.58,0,0,1,3.27,7.82A4.66,4.66,0,0,1,291,81.71Z'/%3e%3cpath%20class='cls-4'%20d='M424.48,81.74a4.71,4.71,0,0,1-2.71-.88,5.43,5.43,0,0,1-1-1l-.07-.09-12.41-17-5.41,5v9.44a4.31,4.31,0,0,1-1.36,3.19,4.66,4.66,0,0,1-3.3,1.36A4.29,4.29,0,0,1,395,80.42a4.36,4.36,0,0,1-1.32-3.23V27.37A4.58,4.58,0,0,1,395,24.1a4.52,4.52,0,0,1,6.58.12,4.54,4.54,0,0,1,1.24,3.15V56.31l17.72-16.38.05,0a4.8,4.8,0,0,1,2.94-1.11,4.4,4.4,0,0,1,3.27,1.2,4.57,4.57,0,0,1,1.2,3.27,4.44,4.44,0,0,1-.77,2.33,7.45,7.45,0,0,1-1.43,1.65l-11,9.64,13.34,17.68a5,5,0,0,1,1,2.71,4.12,4.12,0,0,1-1.36,3.24A4.64,4.64,0,0,1,424.48,81.74Z'/%3e%3cpath%20class='cls-4'%20d='M317.93,81.76a21.5,21.5,0,1,1,21.17-21.5A21.37,21.37,0,0,1,317.93,81.76Zm0-34.1a12.61,12.61,0,1,0,12.42,12.6A12.52,12.52,0,0,0,317.93,47.66Z'/%3e%3cpath%20class='cls-4'%20d='M212.18,101.22a4.12,4.12,0,0,1-3.05-1.26,4.17,4.17,0,0,1-1.26-3.1V43.34a4.37,4.37,0,0,1,1.3-3.14,4.26,4.26,0,0,1,3.13-1.3,4.19,4.19,0,0,1,3.1,1.26,4.32,4.32,0,0,1,1.26,3.16,20.77,20.77,0,0,1,13-4.54,21.51,21.51,0,0,1,0,43,20.51,20.51,0,0,1-13-4.57V96.86a4.15,4.15,0,0,1-1.3,3.06A4.5,4.5,0,0,1,212.18,101.22Zm17.43-53.63c-6.23,0-12.93,4.11-12.93,12.72a12.73,12.73,0,0,0,25.46,0A12.71,12.71,0,0,0,229.61,47.59Z'/%3e%3cpath%20class='cls-4'%20d='M365.76,81.76a21.5,21.5,0,1,1,21.18-21.5A21.37,21.37,0,0,1,365.76,81.76Zm0-34.1a12.61,12.61,0,1,0,12.42,12.6A12.52,12.52,0,0,0,365.76,47.66Z'/%3e%3c/svg%3e)