LinkedIn 2026 Content Algorithm Report: These 3 types of content saw a 47% surge in reach, and your team is still sending the wrong kind.
Shocking Data – A Report Silences the Entire B2B Social Media Industry
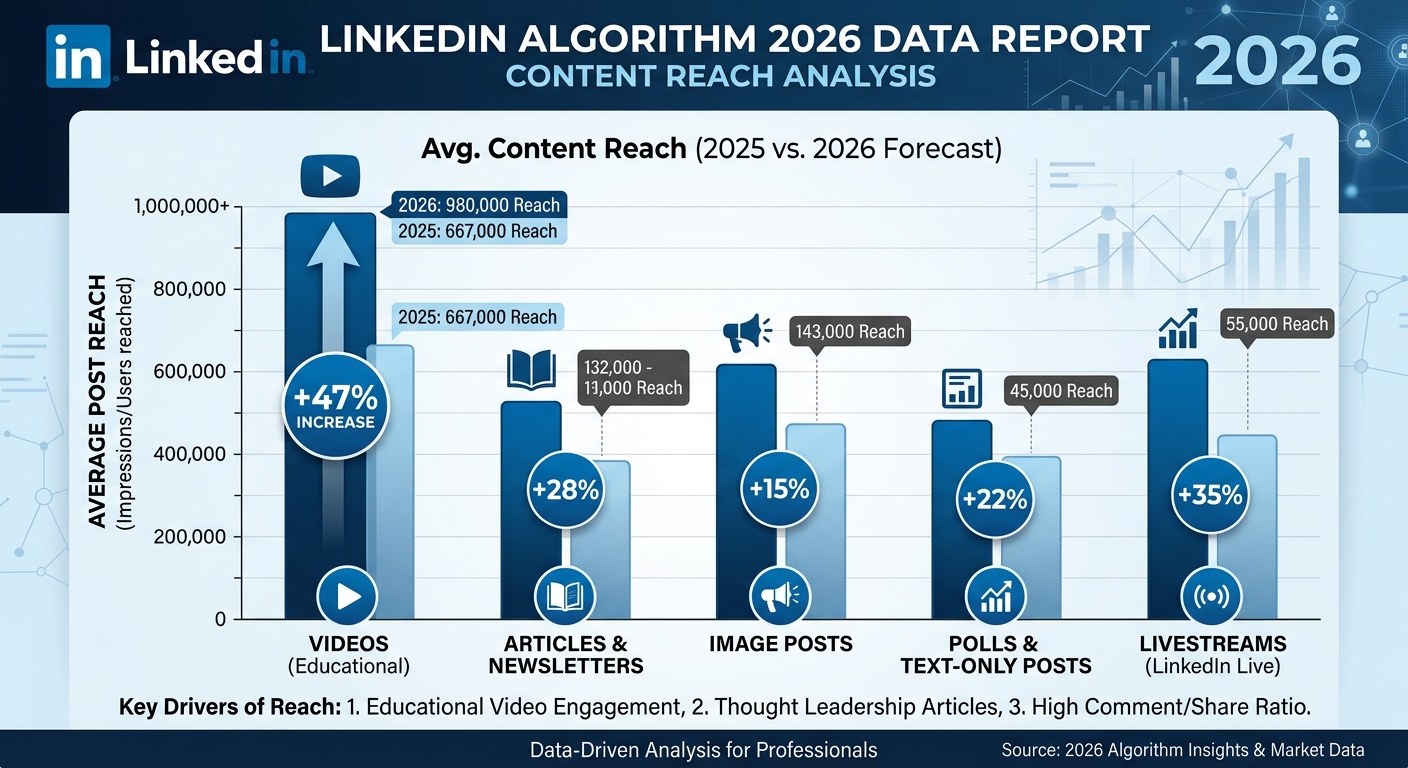
LinkedIn's annual Algorithm Transparency Report, released in March 2026, revealed the largest structural divergence in platform content reach since 2019: average reach for three specific content categories increased by 47% year-over-year, while organic reach for other content types declined by nearly 29% . This figure quickly caused a stir in the B2B social media operations community—not because the algorithm changed again, but because the vast majority of teams had been doing the "wrong kind" for the past two years.
According to the original report, LinkedIn named this algorithm iteration "Value -First Distribution." Its core logic has completely shifted from "content engagement determining distribution weight" to "content value depth determining distribution scope." This means that a large number of likes does not necessarily guarantee wider reach, and a lively comment section does not necessarily mean the algorithm will push your content further away—what truly determines the fate of your content is how long it stays with readers and how deeply it triggers their thinking.
The report also included a set of data that left people speechless:
- Globally, 68% of the content on LinkedIn business accounts still falls under the "Company News and Announcements" category, and the average reach of this type of content has plummeted by 33% under the new algorithm;
- Only 11% of enterprise accounts published "in-depth industry insights" content in the past 6 months, but the average reach of this type of content was 3.2 times that of the average enterprise content across the entire platform;
- Accounts that publish "carousel" content have a save rate 5.7 times higher than those that publish regular text and images, which is one of the signals that the new version of the algorithm values most.
If your team spent a significant budget last year on corporate news, product launches, and event announcements, then this report is telling you one thing: the distribution rights for that content have been systematically compressed by algorithms.
In-depth analysis – What exactly does the algorithm reward?
I. What are the three types of content that have seen a surge in reach?
According to LinkedIn's algorithm transparency report and data tracked by the third-party research firm Social Media Examiner in Q1 2026, the three types of content with significantly increased reach are:
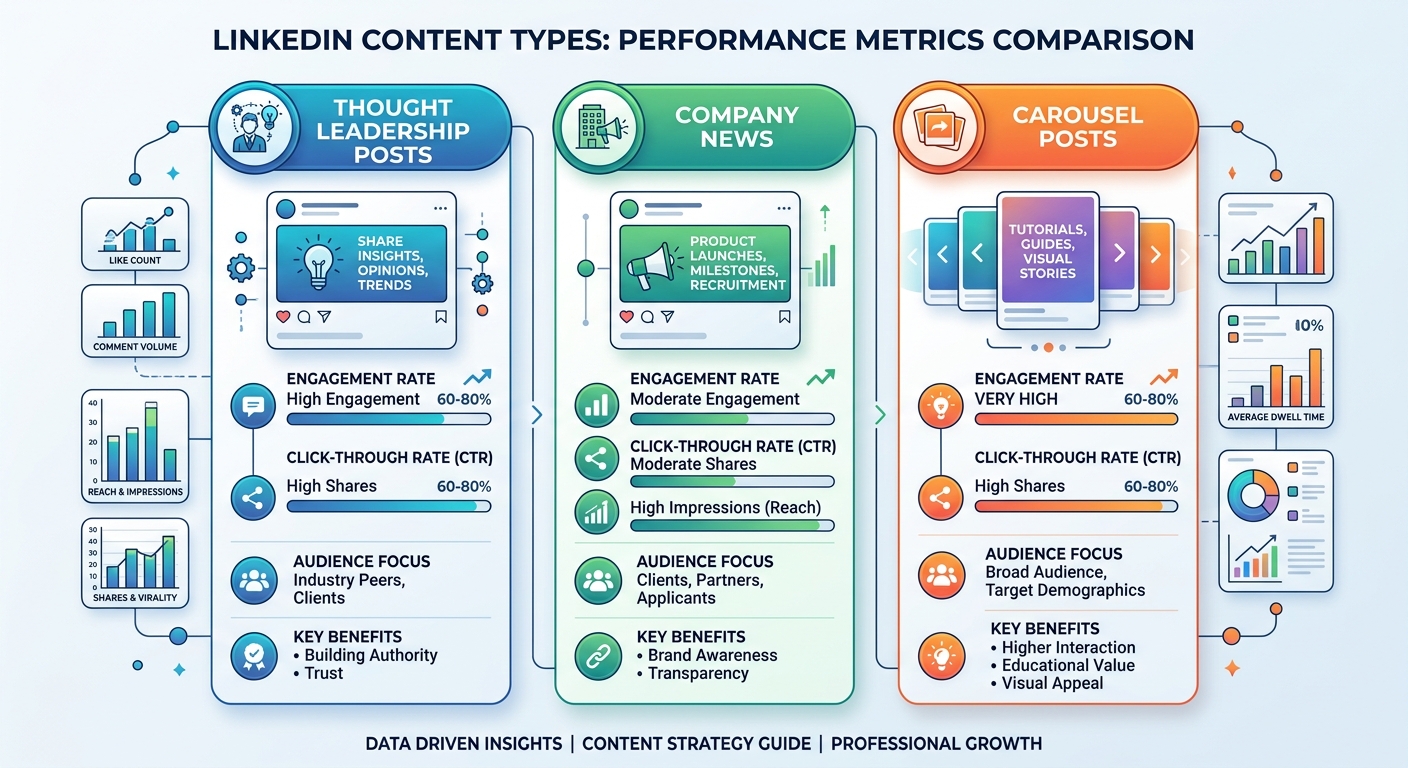
✅ Type 1: Industry-specific "Thought Leadership" content
This isn't just a CEO's quote accompanied by an image; it's a professionally written article with a clear stance, supported by data, and featuring counterintuitive judgments . The LinkedIn report explicitly points out that the "save + share" combination of this type of content is the core trigger for algorithmic dissemination. Specific characteristics:
- The word count should be between 900 and 1400 words (neither too short a "golden quote" nor too long a white paper summary).
- It contains at least one counterintuitive statement (e.g., "Why most companies misunderstand LinkedIn's algorithm").
- Publishing through an author's account rather than a company page yields better results—personal accounts reach 2.8 times more than corporate pages.
Data reference: For companies that publish this type of content, the average reach of their employees' personal accounts reached 4,200 times per article in Q1 2026, far exceeding the average of 1,100 times per article for corporate content across the entire platform.
✅ Type 2: Data-Driven Carousel
Carousel content isn't new, but "data-driven carousels" are a completely different species. Their core is replacing design with structured data narratives . Reports show that carousel content containing original data or research findings has a 63% higher "completion rate" than purely design-driven carousels, and the completion rate is one of the most important distribution signals from the new algorithm.
Typical structure: Cover page (digital hook) → Data panorama (2-3 pages) → Analysis and interpretation (3-4 pages) → Action recommendations (1-2 pages) → Summary + CTA (1 page).
✅ Type 3: Situational Q&A Video
It's not a brand promotional video, nor a product demonstration—it's about answering the question, "How do your competitors solve this problem?" for a specific business scenario . After improving the overall reach of LinkedIn video content in 2025, in 2026 the algorithm further favored distributing resources to videos with a completion rate > 50%.
Data reference: Videos with an average length of 90-150 seconds that start with a "pain point scenario" have a 41% higher completion rate than brand promotion videos, and the algorithm recommendation weight is increased by about 2.3 times accordingly.
2. Why is the reach of "company news" content collapsing?
Many operations teams' first reaction to this issue is that the platform is limiting the traffic to enterprise pages. However, the LinkedIn report provides a more fundamental explanation: this type of content receives almost "zero input" in terms of algorithmic behavioral signals .
The new algorithm's distribution decision depends on the following signals (sorted by weight):
- Content save rate — the highest weighted metric, indicating the long-term reference value of the content for readers.
- Complete Rate — Reflects the actual depth of content.
- Delayed engagement — Interactions that occur 24 hours after publication, indicating that the content is being actively searched and shared.
- Comment Depth — Longer comments and comments that spark discussion are weighted higher than emoji replies.
- Immediate engagement — likes and quick comments have significantly lower weight.
The problem with company news announcements is that they contribute almost nothing to the first four signals. Readers won't save them, won't read them to the end, won't remember them two days later, and won't write a serious discussion about them. What they often get are only polite likes from employees—which is precisely the signal with the lowest weight.
III. The "Content Structure Trap" of B2B Brands
In February 2026, research firm Demand Gen Report analyzed the LinkedIn operations of 638 B2B companies worldwide, and the results were alarming:
- In 74% of corporate LinkedIn posts, "Company News/Product Launches/Event Announcements" account for more than 60%.
- Only 9% of companies have established a systematic thought leadership content production process.
- 83% of operations teams stated that they "lack a fixed data analysis process to evaluate the effectiveness of LinkedIn content."
- Among the top 10% of B2B accounts in terms of content reach, 91% use carousel content as their core content format.
This data reveals a harsh reality: most B2B teams' LinkedIn strategy is to trade "the safest content" (safe for internal reporting and safe for presentation to leaders) for "the worst distribution results".
By tracking content save rates and full read rates using LinkedIn's data analytics tools, you'll find this "trap" clearly visible in your own account data—it's just that nobody tells you how to look at it.
Action Plan – A 30-Day Guide to Content Strategy Restructuring
Step 1: Audit the existing content structure (Days 1-3)
Before adjusting your strategy, you need to understand your current situation. Pull out LinkedIn content data from the past 90 days and categorize it according to the following dimensions:
- Content type breakdown (Company News/Thought Leadership/Carousel/Videos/External Links)
- Average reach, save rate, and comment quality distribution for each type
- Common characteristics of the top 5 most-reached articles
Using data analytics can shorten this audit process from 3 days to 2 hours—the system automatically identifies content types and generates comparison reports, allowing you to see at a glance which types of content are "holding you back."
Step 2: Reconstruct the content calendar (Days 4-7)
Based on the distribution logic of LinkedIn's 2026 algorithm report, it is recommended that B2B brands adjust their content allocation as follows:
- Thought Leadership Content: 40% (1-2 articles per week, primarily published through employee/executive personal accounts)
- Data Carousel Content: 30% (1-2 every two weeks, focusing on industry data or original insights)
- Contextualized videos: 20% (2-4 videos per month, starting with a customer pain point scenario)
- Company News: 10% (Only truly significant milestones, such as financing and important partnerships, are retained)
LinkedIn's scheduled posting feature can help teams plan and schedule these four types of content in advance, ensuring a stable content rhythm and avoiding a drop in quality caused by rushing to write at the last minute close to the publication window.
Step 3: Build a content factory for thought leadership (Days 8-20)
Thought leadership content is the most difficult type of content for B2B brands to scale on LinkedIn. The key challenge is that this type of content requires "genuine professional judgment," rather than public relations copy that can be mass-produced by marketing writers.
Feasible scalability paths:
- Unearthing internal experts : Establish weekly 30-minute "opinion gathering meetings" with product, sales, and customer service teams, allowing the marketing department to organize the content into a structured format.
- Establish a topic pool : Extract topics from frequently asked customer questions, counterintuitive data from industry reports, and competitor activities.
- Personal account matrix : Designate 5-10 core employees as content publishing nodes, with the company page handling forwarding and aggregation.
With the help of AI automation , key points from experts' speeches can be quickly transformed into content formats that conform to LinkedIn's algorithm preferences, significantly lowering the barrier to producing thought leadership content.
Step 4: Activate the data-driven carousel content pipeline (Days 15-25)
Many teams fail to create effective data carousels because they treat them like a collection of PowerPoint slide covers—beautiful but lacking in information density. Truly high-reach data carousels should follow this structure:
- Cover (Page 1) : A numerical hook that compels the target audience to "swipe right," such as "47% of LinkedIn content reach is quietly disappearing—see if you are one of them."
- Data layer (pages 2-4) : 2-3 core data points, accompanied by concise charts; each page focuses on only one point.
- Interpretation layer (pages 5-7) : Tells the reader "what this means," connecting it to specific business scenarios.
- Action Level (Pages 8-9) : 3 Immediately Actionable Recommendations
- Closing Remarks (Page 10) : Save Tip ("Save this guide for future content meetings") + Lightweight CTA
With the competitor monitoring feature, you can track the interactive performance of your competitors' carousel content in real time, quickly identify which topics and structures resonate most with your target audience, and optimize your content based on data, not just gut feeling.

Step 5: Establish a weekly data review mechanism (days 21-30)
After adjusting the strategy, verifying the results is equally crucial. LinkedIn's algorithm is dynamic, and content performance is adjusted in real time based on audience feedback. It is recommended to establish the following weekly review metrics system:
- Key metrics : Reach rate, save rate, and complete read rate (compared by content type)
- Growth Metrics : Distribution of new followers (whether it's organic reach from content or advertising)
- Conversion metrics : Conversion rate from LinkedIn content to the official website, and lead form submission tracking.
A complete LinkedIn analytics dashboard allows you to complete this review in 20 minutes each week, instead of spending half a day each month organizing and exporting data.
Long-term implications of LinkedIn's algorithm changes for B2B content teams
LinkedIn's latest "Value-First Distribution" algorithm update is essentially a correction of the "content inflation" problem that has plagued the platform for the past five years. When every company is issuing press release-style content, the algorithm can only maintain user experience by raising the bar—and that bar happens to be "real value."
For B2B brands, this is both a crisis and an opportunity. The crisis lies in the fact that the old, low-barrier content strategy of "any content posting guarantees reach" is no longer effective. The opportunity lies in the fact that teams that adjust their strategies first, before most competitors realize the problem, will reap the systemic benefits of the algorithm.
In 2026, LinkedIn is becoming the most worthwhile organic growth channel for B2B brands to invest in—but only if you stop posting content that nobody saves.
Frequently Asked Questions (FAQ)
Q1: Is the 47% increase in reach mentioned in LinkedIn's 2026 Algorithm Report an average across all content types?
No. The 47% figure represents the weighted average increase in reach for three content categories: "industry-perspective thought leadership content," "data-driven carousels," and "scenario-based Q&A videos." The specific increase varies for each category. Content that simply uses "likes as bait" and "company news" actually saw a decrease in reach.
Q2: How different are Company Pages and Personal Profiles under the new algorithm?
According to LinkedIn's report, for content of the same quality, posts from personal accounts have an average reach rate approximately 2.8 times higher than those from company pages. This is because LinkedIn's algorithm assigns a higher trust weight to authentic expressions from personal accounts on professional topics. It is recommended that B2B brands transform their company pages into content aggregation centers, using employee personal accounts as the primary content publishing nodes.
Q3: How can a small team produce thought leadership content when they don't have many "executives/experts"?
The core of thought leadership content is "genuine judgment with a standpoint," not necessarily something only the most senior person can express. You can start with customer success teams : they encounter real user problems daily and have a wealth of material that can be compiled into content on "industry phenomena you might not know." Small teams can begin with 2-4 articles per month, prioritizing quality and gradually establishing a rhythm.
Q4: Do you need a professional design team to create carousel content?
No. Data shows that "simple design" carousels with high information density and clear structure often outperform "visually appealing but content-sparse" designs. Tools like Canva and Figma, combined with a clear content framework, can fully support the production of high-quality carousels. The key is not design, but data-driven topics and narrative structure .
Q5: How does SocialEcho help the team execute this LinkedIn content strategy?
SocialEcho is an all-in-one operations platform designed specifically for B2B social media teams, covering the entire chain from content planning to data review. In LinkedIn operations, SocialEcho offers: content calendar management and scheduled publishing (supporting batch scheduling by account matrix), multi-dimensional analysis of reach/save/complete read rate (no need for manual data export), competitor content performance monitoring (real-time tracking of interaction trends in peer carousels and thought leadership content), and AI-assisted content generation (quickly converting expert key points into LinkedIn-formatted text). Basic version starts at 12.5/month, team version starts at 18.75/month, with a 20% discount for annual payments. Suitable for different sizes of content teams, from independent operations to 5-20 people.
Q6: How do we determine if our current LinkedIn content is among those that are "being suppressed by algorithms"?
The most direct way to judge this is to open your content data from the past 90 days and check the "Save Rate" metric. If most of your content has a save rate below 0.5% (meaning less than 0.5 saves out of every 100 reach), it means your content has almost zero long-term reference value for your audience—and this is precisely the signal that the current algorithm values most. Low reach is just a result; low save rate is the root cause.
Q7: Video content is too expensive to produce for Chinese B2B teams. Can carousel content completely replace it?
From an reach perspective, the distribution performance of high-quality carousel content is very close to that of video, and even better in certain niche scenarios (because audiences are less willing to watch videos in professional settings). If video production costs are the main bottleneck, it is recommended to focus resources on thought leadership articles and data-driven carousels first, and then gradually introduce videos as the content strategy matures. Combining both yields the best results, but carousels alone can also achieve significant success.
;}.cls-2{fill:%230868f7;}.cls-3{fill:url(%23未命名的渐变_44);}.cls-4{fill:%23333;}%3c/style%3e%3clinearGradient%20id='未命名的渐变_8'%20x1='33.73'%20y1='100.61'%20x2='-0.03'%20y2='-1.06'%20gradientUnits='userSpaceOnUse'%3e%3cstop%20offset='0'%20stop-color='%237ae9fb'/%3e%3cstop%20offset='0.67'%20stop-color='%232b90f8'/%3e%3cstop%20offset='1'%20stop-color='%230868f7'/%3e%3c/linearGradient%3e%3clinearGradient%20id='未命名的渐变_44'%20x1='27.86'%20y1='18.67'%20x2='68.36'%20y2='22.22'%20gradientUnits='userSpaceOnUse'%3e%3cstop%20offset='0'%20stop-color='%235ac7f2'/%3e%3cstop%20offset='1'%20stop-color='%230868f7'/%3e%3c/linearGradient%3e%3c/defs%3e%3cpath%20class='cls-1'%20d='M29,28.74V81.91l-9.51-3.68v0L8.52,74A7.17,7.17,0,0,1,4,67.32V24.54A3.76,3.76,0,0,1,9.08,21Z'/%3e%3cpath%20class='cls-2'%20d='M68.09,78.07a13.15,13.15,0,0,1-17.9,12.06L29,81.91h0V28.74L50.19,37A13.17,13.17,0,0,0,68.08,25.3h0Z'/%3e%3cpath%20class='cls-3'%20d='M68.08,25.3a13.19,13.19,0,0,1-6.73,10.87A13.09,13.09,0,0,1,50.19,37L29,28.74V6A3.76,3.76,0,0,1,34.1,2.52l25.59,9.91A13.22,13.22,0,0,1,68.08,25.3Z'/%3e%3cpath%20class='cls-4'%20d='M129.06,81.76a4.33,4.33,0,0,1-3.19-1.31,4.4,4.4,0,0,1-1.31-3.24V56.86H97.65V77.21a4.36,4.36,0,0,1-1.35,3.2A4.68,4.68,0,0,1,93,81.76a4.32,4.32,0,0,1-3.19-1.31,4.37,4.37,0,0,1-1.32-3.24V27.27A4.58,4.58,0,0,1,89.83,24a4.59,4.59,0,0,1,7.82,3.27V48.15h26.91V27.27A4.58,4.58,0,0,1,125.91,24a4.59,4.59,0,0,1,7.82,3.27V77.21a4.37,4.37,0,0,1-1.36,3.2A4.65,4.65,0,0,1,129.06,81.76Z'/%3e%3cpath%20class='cls-4'%20d='M163.77,81.66c-6.57,0-11.76-1.92-15.44-5.7s-5.54-9.07-5.54-15.74a26.76,26.76,0,0,1,2.09-10.43,17.72,17.72,0,0,1,6.67-8.06,19.15,19.15,0,0,1,10.68-2.95,19,19,0,0,1,10.46,2.8,18.7,18.7,0,0,1,6.55,7.36,22.53,22.53,0,0,1,2.36,10.28A4.51,4.51,0,0,1,177,63.77H152.23a10.8,10.8,0,0,0,3.49,6.65c2,1.68,4.88,2.52,8.66,2.52a22.25,22.25,0,0,0,7.54-1.21c.74-.3,1.55-.67,2.37-1.07a3.75,3.75,0,0,1,1.84-.4,4.09,4.09,0,0,1,3,1.15,4,4,0,0,1,1.12,3,4.38,4.38,0,0,1-2.58,3.82,32.34,32.34,0,0,1-6.36,2.61A28.67,28.67,0,0,1,163.77,81.66ZM172.4,55.9a9.72,9.72,0,0,0-1.63-4.56A9.9,9.9,0,0,0,167,48a10.38,10.38,0,0,0-4.64-1.14,12,12,0,0,0-4.77,1.06,9.54,9.54,0,0,0-4.89,5.66,11.78,11.78,0,0,0-.51,2.3Z'/%3e%3cpath%20class='cls-4'%20d='M193,81.64a4.49,4.49,0,0,1-4.51-4.55V27.28A4.58,4.58,0,0,1,189.84,24a4.48,4.48,0,0,1,3.28-1.36A4.36,4.36,0,0,1,196.35,24a4.46,4.46,0,0,1,1.31,3.31V77.09a4.34,4.34,0,0,1-1.35,3.2A4.67,4.67,0,0,1,193,81.64Z'/%3e%3cpath%20class='cls-4'%20d='M263.79,81.71a5.7,5.7,0,0,1-4.2-1.74,5.76,5.76,0,0,1-1.73-4.19V27.37a4.58,4.58,0,0,1,1.35-3.27A4.59,4.59,0,0,1,267,27.37V72.53h24a4.58,4.58,0,0,1,3.27,7.82A4.66,4.66,0,0,1,291,81.71Z'/%3e%3cpath%20class='cls-4'%20d='M424.48,81.74a4.71,4.71,0,0,1-2.71-.88,5.43,5.43,0,0,1-1-1l-.07-.09-12.41-17-5.41,5v9.44a4.31,4.31,0,0,1-1.36,3.19,4.66,4.66,0,0,1-3.3,1.36A4.29,4.29,0,0,1,395,80.42a4.36,4.36,0,0,1-1.32-3.23V27.37A4.58,4.58,0,0,1,395,24.1a4.52,4.52,0,0,1,6.58.12,4.54,4.54,0,0,1,1.24,3.15V56.31l17.72-16.38.05,0a4.8,4.8,0,0,1,2.94-1.11,4.4,4.4,0,0,1,3.27,1.2,4.57,4.57,0,0,1,1.2,3.27,4.44,4.44,0,0,1-.77,2.33,7.45,7.45,0,0,1-1.43,1.65l-11,9.64,13.34,17.68a5,5,0,0,1,1,2.71,4.12,4.12,0,0,1-1.36,3.24A4.64,4.64,0,0,1,424.48,81.74Z'/%3e%3cpath%20class='cls-4'%20d='M317.93,81.76a21.5,21.5,0,1,1,21.17-21.5A21.37,21.37,0,0,1,317.93,81.76Zm0-34.1a12.61,12.61,0,1,0,12.42,12.6A12.52,12.52,0,0,0,317.93,47.66Z'/%3e%3cpath%20class='cls-4'%20d='M212.18,101.22a4.12,4.12,0,0,1-3.05-1.26,4.17,4.17,0,0,1-1.26-3.1V43.34a4.37,4.37,0,0,1,1.3-3.14,4.26,4.26,0,0,1,3.13-1.3,4.19,4.19,0,0,1,3.1,1.26,4.32,4.32,0,0,1,1.26,3.16,20.77,20.77,0,0,1,13-4.54,21.51,21.51,0,0,1,0,43,20.51,20.51,0,0,1-13-4.57V96.86a4.15,4.15,0,0,1-1.3,3.06A4.5,4.5,0,0,1,212.18,101.22Zm17.43-53.63c-6.23,0-12.93,4.11-12.93,12.72a12.73,12.73,0,0,0,25.46,0A12.71,12.71,0,0,0,229.61,47.59Z'/%3e%3cpath%20class='cls-4'%20d='M365.76,81.76a21.5,21.5,0,1,1,21.18-21.5A21.37,21.37,0,0,1,365.76,81.76Zm0-34.1a12.61,12.61,0,1,0,12.42,12.6A12.52,12.52,0,0,0,365.76,47.66Z'/%3e%3c/svg%3e)