How to Automate Social Media Reporting — Instead of Manually Screenshotting Data Every Week

Li Ming is the social media manager at a consumer brand. Every Friday at 3 PM is his most agonizing moment.
His boss's message is already waiting: "How did each platform perform this week?"
He opens five browser windows — Facebook Business Suite, Instagram Insights, TikTok Creator Center, Twitter Analytics, YouTube Studio — and starts screenshotting, copying data, and pasting into Excel one by one. How many followers gained, what is the engagement rate, which content performed best... every single metric requires manual verification.
Two and a half hours later, he sends the compiled report to his boss.
"Your data is from yesterday, not today."
Li Ming stares at the screen and takes a deep breath.
The Real Cost of Social Media Weekly Reports
Most social media managers have not calculated this hidden cost.
2-3 hours per week compiling data adds up to 100-150 hours per year. Converted to labor costs, this is a significant hidden expense. What is more, manually compiled data inherently has a time lag — the data you report on Friday afternoon is only current as of Thursday night, or even earlier.
In fast-paced social media operations, a single day of data gap is enough to cause bosses to make wrong decisions.
The deeper issue is: manual reporting cannot support trend analysis.
When you screenshot and paste into spreadsheets, you can see this week's absolute numbers, but it is hard to quickly answer:
- Is this week's engagement rate higher or lower than last week's?
- Which platform has the best follower growth efficiency?
- How is the ROI of the content type we invested most heavily in last month?
When the boss asks these questions, you can only say "let me check again."
What Automated Reporting Can Solve
Social media data report automation fundamentally addresses three problems:
1. Data Aggregation
Different platforms use different metrics. Facebook calls it "Reach," Instagram calls it "Impressions," and TikTok has its own algorithm logic. Manually aligning this data is inherently error-prone.
Automated tools can pull multi-platform data uniformly, standardize metrics, and display everything in one interface.
View Instagram Analytics Features
2. Real-Time Refresh
The system automatically pulls the latest data at your configured frequency, eliminating the awkwardness of "the data is from yesterday."
3. Templated Reporting
Once you set up a fixed report template, each week you only need to confirm the data is correct and click export. The entire process shrinks from 2 hours to 15 minutes.
Hands-On: Building Your Social Media Automated Reporting Workflow
Step 1: Identify the Metrics You Actually Need
Not all data belongs in a report. A good weekly report should have no more than 10 core metrics:
| Dimension | Metric |
|---|---|
| Growth | Net new followers per platform |
| Reach | Total impressions, average post reach |
| Engagement | Engagement rate, comments, shares |
| Content | Top 3 performing posts |
| Conversion | Link clicks, website traffic source |
View TikTok Analytics Features
Step 2: Choose a Data Aggregation Tool
Mainstream social media analytics tools fall into two categories:
Platform-Native (Free): Each platform built-in Insights, most accurate data, but requires checking each platform individually with no aggregation.
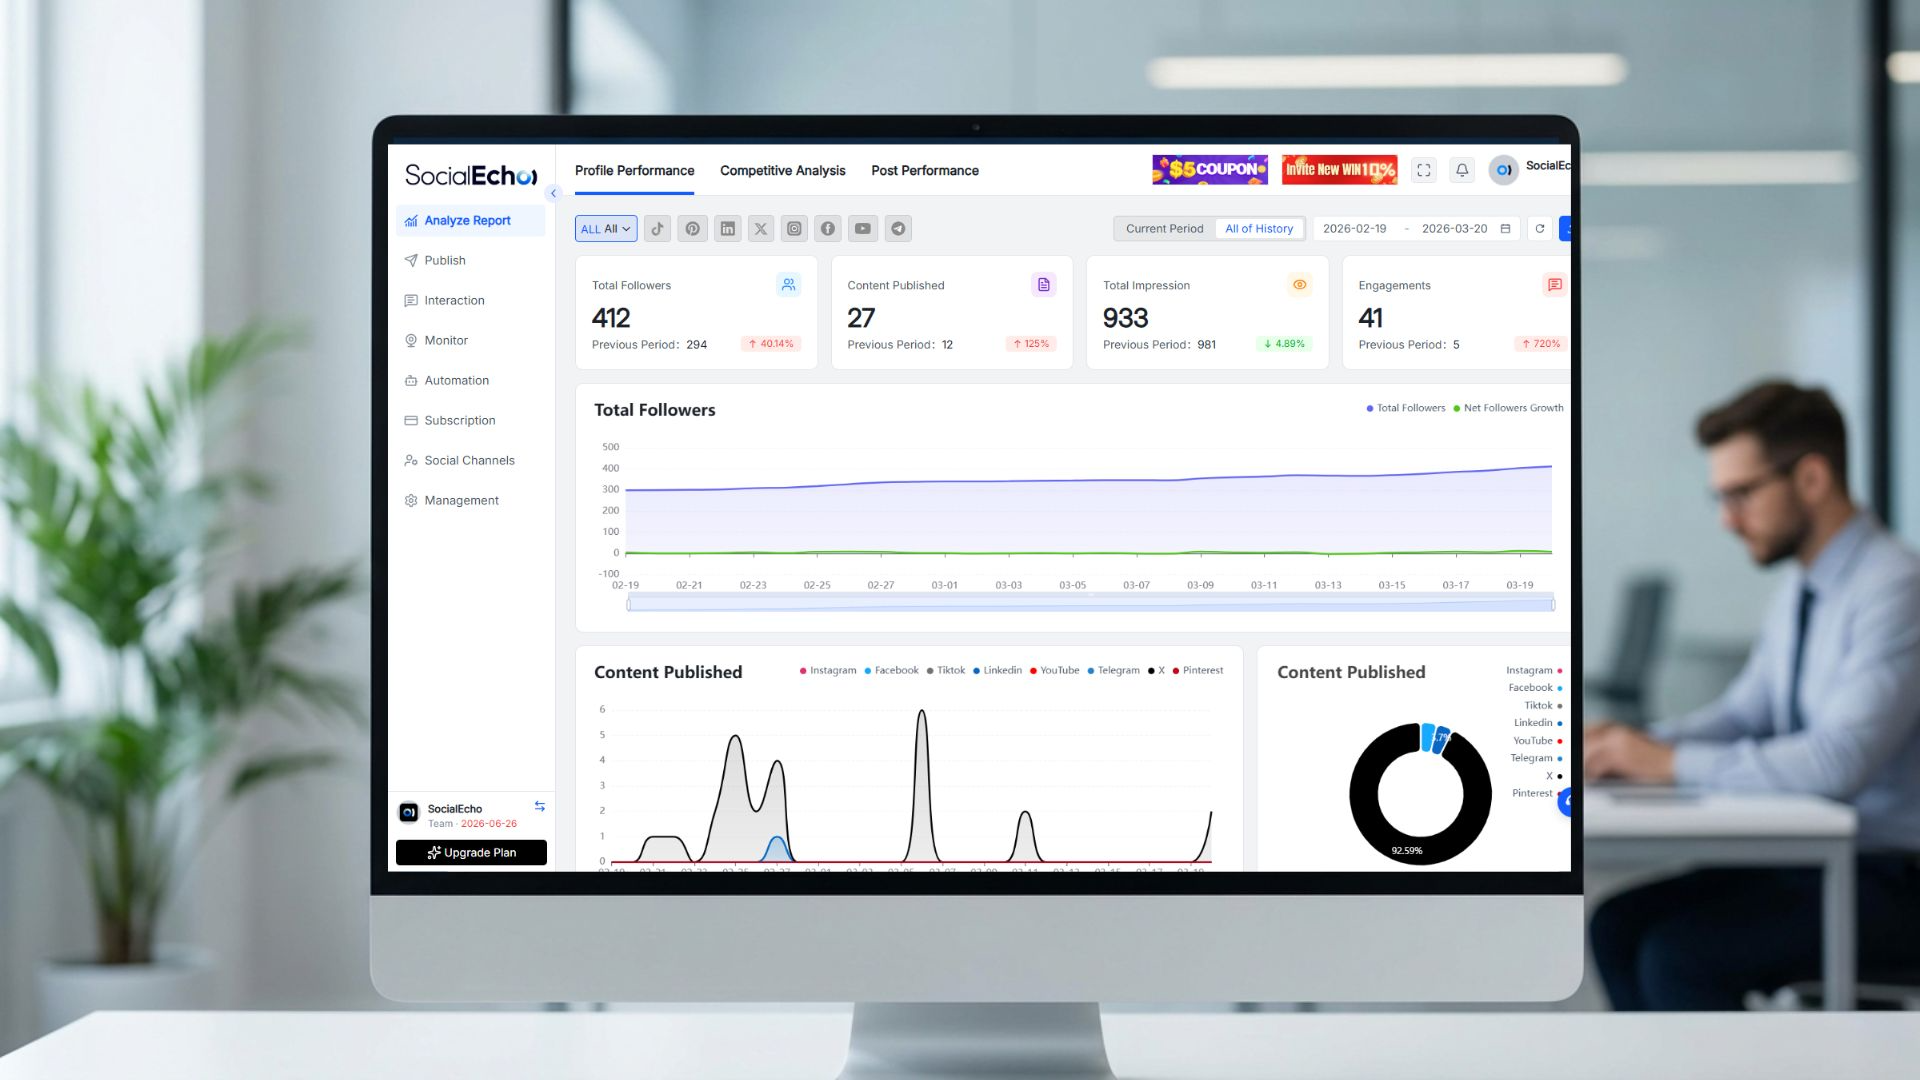
Third-Party Tools (Paid): Support multi-platform integration, automatic aggregation, one-click export. SocialEcho is one such tool, supporting Facebook, Instagram, TikTok, X, and other mainstream platforms in a unified dashboard.
View SocialEcho Analytics Features
Step 3: Build Your Report Template
A good report template should:
- Have a fixed format, directly comparable across weeks
- Automatically calculate week-over-week changes
- Highlight anomalous data (both drops and spikes should be marked)
Step 4: Set Up Automatic Distribution
Configure the report to automatically send to the boss email or enterprise WeChat group every Friday. You only need to do a quick review before sending.
View Facebook Analytics Features
Case Study: A Beauty Brand Report Transformation
A beauty export brand in Shenzhen, with a 4-person operations team managing Instagram, TikTok, and Facebook.
Before: Each weekly report required 3 people spending 1.5 hours each, with inconsistent quality and frequent data contradictions pointed out by the boss.
After: Connected to an automation tool, unified data pulling from all three platforms with a fixed report template. Weekly report time reduced to 20 minutes (mainly for writing this week's summary and next week's plan), with significantly improved data accuracy.
Boss feedback: "Now the reports are actually readable, and they are much more timely than before."
Advanced: Making Reports Actually Useful
Many people social media reports stay at the "number listing" stage, but truly valuable reports should provide insights.
Structure of a good report:
- Weekly Highlights: Which piece of content performed best, and why?
- Weekly Anomalies: Did any data drop sharply, and what is the reason?
- Trend Analysis: Is the engagement rate trending up or down?
- Next Week Priorities: Based on the data, what should be adjusted next week?
The insight section still requires human writing, but with accurate automated data as the foundation, it becomes much faster.
View X Platform Analytics Features
FAQ
Q1: Are data automation tools expensive?
A: Prices vary widely. Entry-level tools run 20-50/month, professional versions 100-300/month. Compared to the labor costs saved, they typically pay for themselves quickly.
Q2: Will there be errors in data aggregation?
A: Mainstream tools pull data through platform official APIs, so accuracy is reliable. However, note that each platform defines "impressions" and "reach" differently — tools usually mark these distinctions.
Q3: My boss wants very granular data dimensions. Can tools handle that?
A: Most tools support custom metrics and custom report dimensions. If your boss has special requirements, confirm tool capabilities before signing up.
Q4: We manage multiple clients, and each client needs a separate report. Is that supported?
A: Yes. Mainstream tools support account/brand grouping, generating independent reports for each client with brand customization options (adding client logos, etc.).
Q5: After switching tools, will historical data still be available?
A: Historical data is stored on each platform. After connecting a tool, you can usually pull historical data from the past 3-18 months. The specific timeframe depends on platform API limits.
Q6: What technical skills are needed to use these tools?
A: Mainstream tools use visual configuration and require no coding ability. Usually, you authorize platform accounts, set report templates, and configure delivery rules — these three steps complete the setup.
Summary
Social media data report automation is not a "high-end tool only for big companies," but an efficiency tool every serious operations team should consider.
Manually screenshotting and compiling data does not just waste time — more importantly, it keeps your reports always one step behind reality.
Starting now, spend your time analyzing data and optimizing strategy, instead of collecting data.

If your team is still doing social media weekly reports manually, welcome to SocialEcho — maybe we can help you save those 2-3 hours every week.
;}.cls-2{fill:%230868f7;}.cls-3{fill:url(%23未命名的渐变_44);}.cls-4{fill:%23333;}%3c/style%3e%3clinearGradient%20id='未命名的渐变_8'%20x1='33.73'%20y1='100.61'%20x2='-0.03'%20y2='-1.06'%20gradientUnits='userSpaceOnUse'%3e%3cstop%20offset='0'%20stop-color='%237ae9fb'/%3e%3cstop%20offset='0.67'%20stop-color='%232b90f8'/%3e%3cstop%20offset='1'%20stop-color='%230868f7'/%3e%3c/linearGradient%3e%3clinearGradient%20id='未命名的渐变_44'%20x1='27.86'%20y1='18.67'%20x2='68.36'%20y2='22.22'%20gradientUnits='userSpaceOnUse'%3e%3cstop%20offset='0'%20stop-color='%235ac7f2'/%3e%3cstop%20offset='1'%20stop-color='%230868f7'/%3e%3c/linearGradient%3e%3c/defs%3e%3cpath%20class='cls-1'%20d='M29,28.74V81.91l-9.51-3.68v0L8.52,74A7.17,7.17,0,0,1,4,67.32V24.54A3.76,3.76,0,0,1,9.08,21Z'/%3e%3cpath%20class='cls-2'%20d='M68.09,78.07a13.15,13.15,0,0,1-17.9,12.06L29,81.91h0V28.74L50.19,37A13.17,13.17,0,0,0,68.08,25.3h0Z'/%3e%3cpath%20class='cls-3'%20d='M68.08,25.3a13.19,13.19,0,0,1-6.73,10.87A13.09,13.09,0,0,1,50.19,37L29,28.74V6A3.76,3.76,0,0,1,34.1,2.52l25.59,9.91A13.22,13.22,0,0,1,68.08,25.3Z'/%3e%3cpath%20class='cls-4'%20d='M129.06,81.76a4.33,4.33,0,0,1-3.19-1.31,4.4,4.4,0,0,1-1.31-3.24V56.86H97.65V77.21a4.36,4.36,0,0,1-1.35,3.2A4.68,4.68,0,0,1,93,81.76a4.32,4.32,0,0,1-3.19-1.31,4.37,4.37,0,0,1-1.32-3.24V27.27A4.58,4.58,0,0,1,89.83,24a4.59,4.59,0,0,1,7.82,3.27V48.15h26.91V27.27A4.58,4.58,0,0,1,125.91,24a4.59,4.59,0,0,1,7.82,3.27V77.21a4.37,4.37,0,0,1-1.36,3.2A4.65,4.65,0,0,1,129.06,81.76Z'/%3e%3cpath%20class='cls-4'%20d='M163.77,81.66c-6.57,0-11.76-1.92-15.44-5.7s-5.54-9.07-5.54-15.74a26.76,26.76,0,0,1,2.09-10.43,17.72,17.72,0,0,1,6.67-8.06,19.15,19.15,0,0,1,10.68-2.95,19,19,0,0,1,10.46,2.8,18.7,18.7,0,0,1,6.55,7.36,22.53,22.53,0,0,1,2.36,10.28A4.51,4.51,0,0,1,177,63.77H152.23a10.8,10.8,0,0,0,3.49,6.65c2,1.68,4.88,2.52,8.66,2.52a22.25,22.25,0,0,0,7.54-1.21c.74-.3,1.55-.67,2.37-1.07a3.75,3.75,0,0,1,1.84-.4,4.09,4.09,0,0,1,3,1.15,4,4,0,0,1,1.12,3,4.38,4.38,0,0,1-2.58,3.82,32.34,32.34,0,0,1-6.36,2.61A28.67,28.67,0,0,1,163.77,81.66ZM172.4,55.9a9.72,9.72,0,0,0-1.63-4.56A9.9,9.9,0,0,0,167,48a10.38,10.38,0,0,0-4.64-1.14,12,12,0,0,0-4.77,1.06,9.54,9.54,0,0,0-4.89,5.66,11.78,11.78,0,0,0-.51,2.3Z'/%3e%3cpath%20class='cls-4'%20d='M193,81.64a4.49,4.49,0,0,1-4.51-4.55V27.28A4.58,4.58,0,0,1,189.84,24a4.48,4.48,0,0,1,3.28-1.36A4.36,4.36,0,0,1,196.35,24a4.46,4.46,0,0,1,1.31,3.31V77.09a4.34,4.34,0,0,1-1.35,3.2A4.67,4.67,0,0,1,193,81.64Z'/%3e%3cpath%20class='cls-4'%20d='M263.79,81.71a5.7,5.7,0,0,1-4.2-1.74,5.76,5.76,0,0,1-1.73-4.19V27.37a4.58,4.58,0,0,1,1.35-3.27A4.59,4.59,0,0,1,267,27.37V72.53h24a4.58,4.58,0,0,1,3.27,7.82A4.66,4.66,0,0,1,291,81.71Z'/%3e%3cpath%20class='cls-4'%20d='M424.48,81.74a4.71,4.71,0,0,1-2.71-.88,5.43,5.43,0,0,1-1-1l-.07-.09-12.41-17-5.41,5v9.44a4.31,4.31,0,0,1-1.36,3.19,4.66,4.66,0,0,1-3.3,1.36A4.29,4.29,0,0,1,395,80.42a4.36,4.36,0,0,1-1.32-3.23V27.37A4.58,4.58,0,0,1,395,24.1a4.52,4.52,0,0,1,6.58.12,4.54,4.54,0,0,1,1.24,3.15V56.31l17.72-16.38.05,0a4.8,4.8,0,0,1,2.94-1.11,4.4,4.4,0,0,1,3.27,1.2,4.57,4.57,0,0,1,1.2,3.27,4.44,4.44,0,0,1-.77,2.33,7.45,7.45,0,0,1-1.43,1.65l-11,9.64,13.34,17.68a5,5,0,0,1,1,2.71,4.12,4.12,0,0,1-1.36,3.24A4.64,4.64,0,0,1,424.48,81.74Z'/%3e%3cpath%20class='cls-4'%20d='M317.93,81.76a21.5,21.5,0,1,1,21.17-21.5A21.37,21.37,0,0,1,317.93,81.76Zm0-34.1a12.61,12.61,0,1,0,12.42,12.6A12.52,12.52,0,0,0,317.93,47.66Z'/%3e%3cpath%20class='cls-4'%20d='M212.18,101.22a4.12,4.12,0,0,1-3.05-1.26,4.17,4.17,0,0,1-1.26-3.1V43.34a4.37,4.37,0,0,1,1.3-3.14,4.26,4.26,0,0,1,3.13-1.3,4.19,4.19,0,0,1,3.1,1.26,4.32,4.32,0,0,1,1.26,3.16,20.77,20.77,0,0,1,13-4.54,21.51,21.51,0,0,1,0,43,20.51,20.51,0,0,1-13-4.57V96.86a4.15,4.15,0,0,1-1.3,3.06A4.5,4.5,0,0,1,212.18,101.22Zm17.43-53.63c-6.23,0-12.93,4.11-12.93,12.72a12.73,12.73,0,0,0,25.46,0A12.71,12.71,0,0,0,229.61,47.59Z'/%3e%3cpath%20class='cls-4'%20d='M365.76,81.76a21.5,21.5,0,1,1,21.18-21.5A21.37,21.37,0,0,1,365.76,81.76Zm0-34.1a12.61,12.61,0,1,0,12.42,12.6A12.52,12.52,0,0,0,365.76,47.66Z'/%3e%3c/svg%3e)