The boss asks: How many inquiries did your social media spending generate last month? You can't answer.

On Monday morning, I was stumped by a question.
In the meeting room, the boss flipped through the calendar, his tone calm, but every word carried weight:
"How much time did you spend on TikTok and Instagram last month? How much content did you post? How many inquiries did you generate?"
You paused for a second.
It's not because I don't know the answer, but because I know that the answer doesn't exist in some corner of my mind—it's scattered across five apps, hidden in the data reports of four backends, and some of it wasn't even recorded at all.
You take out your phone, open the TikTok creator backend, and find last month's view and engagement data. Then you switch to Instagram and look at the reach in Insights. Next, you open Facebook Business Suite and check the number of comments on your profile. LinkedIn requires a separate login, and the data format is completely different from other platforms. Finally, you discover that those dozens of comments asking "how to order," "what's the MOQ," and "do you ship to Europe" were not counted anywhere in the statistics.
You look up and say to your boss, "I'll tidy it up and send it to you."
The boss nodded, and the meeting continued. But you know that for the next two hours, you'll be facing that data swamp alone.
Two hours later, you open Excel, staring at the cobbled-together spreadsheet. The formatting is inconsistent, the data is misaligned—Instagram data is weekly, TikTok is monthly cumulative, and LinkedIn data is still missing for a few days. You're unsure if this spreadsheet answers your boss's question, but you have no choice but to send it out.
This is not a problem unique to you.
That data that's always "edited before posting"
The social media operations teams of global brands typically consist of only one to three people. They manage TikTok, Instagram, Facebook, LinkedIn, and sometimes YouTube and Pinterest as well. Each platform has its own content rhythm, publishing logic, audience profiles, and completely different data backends.
The number of followers is here, the exposure is there, the number of comments needs to be viewed on a separate page, and the interaction rate needs to be calculated manually. To compile a cross-platform monthly report, the process typically looks like this:
First, I logged into the TikTok Creator Center and exported a CSV file, but found that the field names were in English, requiring me to translate each column. Then, I opened Instagram Insights and discovered that I could only view the past 30 days, and last month spanned two calendar months, requiring me to manually calculate the difference. Next, I went to Facebook Business Suite and found the page overview data, but the statistical methods differed from Instagram's—Instagram calculates "reach," while Facebook calculates "post impressions," and these two cannot be directly added together. Finally, I opened LinkedIn Analytics, only to find that the enterprise account required administrator privileges, and my colleague had changed the password yesterday but hadn't synced it with me yet.
By the time you've gathered the data from all four platforms, about an hour has passed. Then you have to open Excel, manually fill in the data column by column, standardize the time format, fill in any missing fields, and then use formulas to calculate year-on-year, month-on-month, and interaction rates.
After doing all that, the spreadsheet you sent to your boss still didn't answer the question of "how many inquiries were generated".
Because "inquiries" aren't stored in any platform's data backend. Users genuinely interested in buying leave their questions in the comments section, in private messages, and in the "interested," "DM me," or "link in bio?" interactions below posts. No platform automatically identifies, aggregates, or tags these signals.
This is the most realistic situation for social media operations of brands going global: content is published, money is spent, and manpower is invested, but when someone asks, "What have these investments brought?", your answer is, "Let me sort it out."
Why is this question so difficult to answer?
On the surface, this seems like a problem of "data being too scattered." But digging deeper, you'll find that it's not just a tool issue, but rather that the data foundation for the entire social media operation was never established in the first place.
Data is scattered across isolated silos and cannot be aggregated.
Each social media platform is a closed data silo. TikTok's data won't appear in Instagram's reports, and LinkedIn's engagement data won't be presented in the same table as Facebook's follower growth. This isn't a platform oversight, but rather a business design choice—each platform wants you to conduct analysis and make decisions within its own ecosystem. But for a brand team operating across multiple platforms overseas, this means going through the grueling process of data migration every time they report.
According to industry research data, a social media operations team of 1 to 3 people spends an average of more than 12 hours per month on "data processing and report production." This is a conservative estimate—if they also need to beautify charts, supplement analytical text, and deal with unexpected questions from the boss, this number can easily exceed 20 hours. In other words, an operations team spends nearly two months per year doing this: moving data from one place to another.
Potential customers in the comments section were not identified or recorded.
This is a more insidious and fatal problem than data dispersion.
When your TikTok video gets 30,000 views and 200 comments flood the comment section, how many of them are genuine purchase intentions? Is "How much does this cost?" considered an inquiry? Is "Where can I buy this?" considered a lead? Is "This is exactly what I need for my store" considered a conversion signal?
In the existing workflow, these signals are either drowned out by the flood of comments or have to be manually reviewed by operations staff, recorded from memory or on sticky notes. There is no system to automatically identify these signals, no tools to categorize them as "high-intent interactions," and no reports to present them to management.
So when your boss asks, "How many inquiries have you brought in?", it's not that you don't know, it's that you simply don't have a mechanism to know.
The link between "content exposure" and "user intent" has been broken.
A piece of content is posted, reaching a certain number of people, with many reading it, clicking on the homepage, leaving comments, expressing purchase intent, and ultimately converting those intents into inquiries—this is a complete funnel. However, in reality, only the first and last segments of this funnel are visible; the rest are completely black boxes.
The operations team knows how much content has been posted and approximately how many views it has. The boss knows the final sales figures. But no one can clearly explain "what contribution the social media operations team actually made in the funnel."
This is the fundamental reason why social media investment has an unclear ROI: it's not that the content is poor or the operations are not hard-working, but that there is a lack of data infrastructure that can translate "content behavior" into "business language".

Act Three: The solution isn't to make operations work harder, but to build a data system that can answer this question.
Some teams respond by buying more tools, hiring more people, or having operations spend more time compiling reports.
However, none of these methods solve the fundamental problem—the data is still fragmented, intent identification still relies on manual intervention, and reports still need to be pieced together manually. They simply make the same things a little faster.
The real solution is to transform the act of "answering this question" from an individual effort in operations into an automatic output from the system.
Step 1: Aggregate data from multiple platforms in one place.
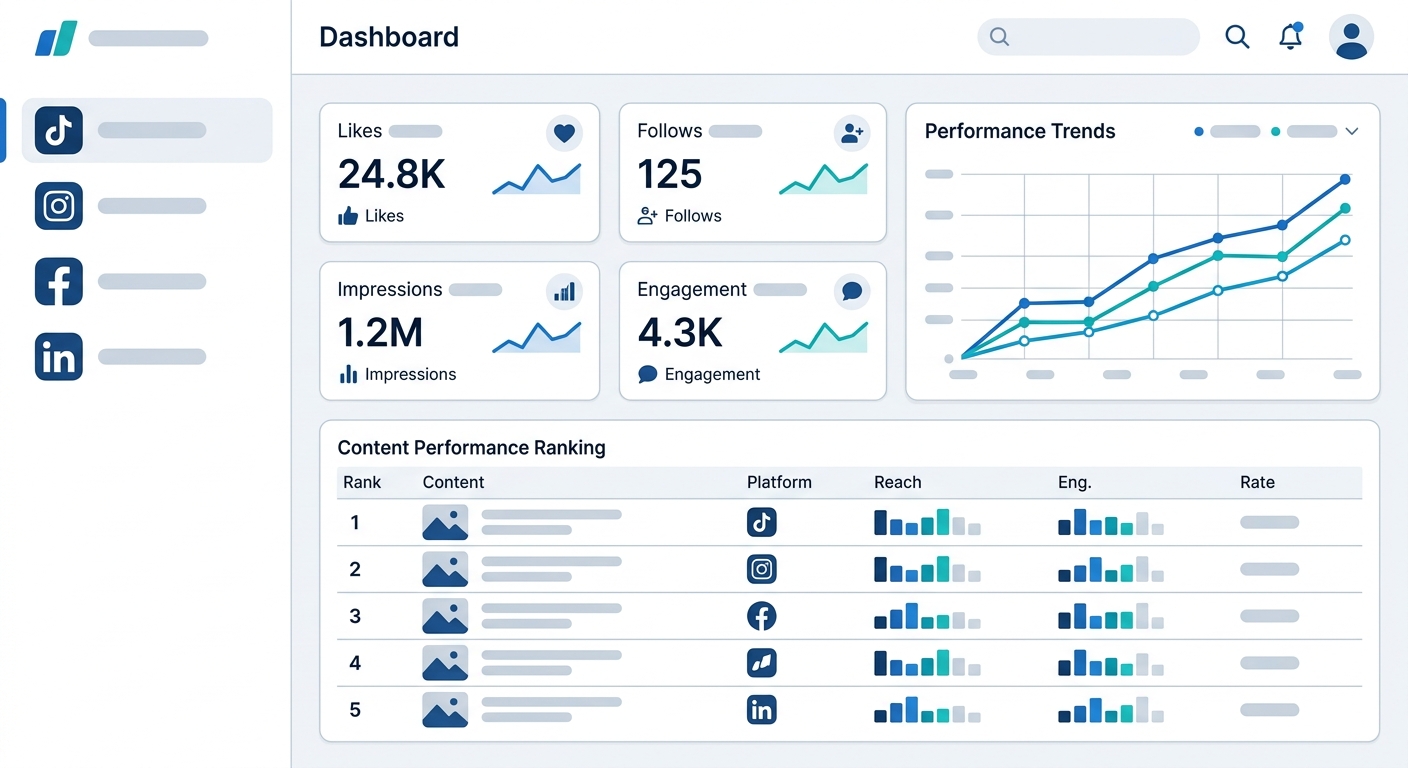
When data from TikTok, Instagram, Facebook, and LinkedIn is no longer scattered across four separate backends, but is aggregated in real time on a unified interface—with follower counts, impressions, interactions, comments, likes, and shares all neatly arranged by platform, account, and time—operators truly gain the ability to "see the big picture."
SocialEcho is a multi-platform operation and management tool designed specifically for social media teams of brands going global. It's suitable for teams of 1 to 5 people who manage 3 or more social media platforms simultaneously. Its data analysis function aggregates data from 8 major social media platforms into a single interface in real time, updating automatically every hour and supporting historical data up to 180 days ago. This means that the next time your boss asks about last month's data, you don't need to open the backend of any individual platform; you can simply filter by time range within SocialEcho, and all the data from all platforms will be displayed on the same screen.
Facebook Analytics , Instagram Analytics , TikTok Analytics , LinkedIn Analytics —data from four platforms is simultaneously visible on a single interface, eliminating the need for four separate logins, four separate export processes, and four separate manual integrations.
Step 2: Make the "intention" visible in the comments section.
This is a problem that most teams have not solved at all, and it is the real reason why "inquiries" cannot be quantified.
The comments section is more than just a feedback loop for brand exposure; it's the moment when potential customers are closest to you. A user asking "Do you have a wholesale program?" in the comments isn't just ordinary interaction; it's a lead. But without a system to recognize it, it will forever remain just that unanswered English sentence in the comments section.
SocialEcho's interaction management features a built-in AI intent recognition model that automatically scans comments and private messages across multiple platforms, categorizing user behavior into different types such as inquiries, purchase intentions, positive reviews, and complaints, with an accuracy rate exceeding 95%. When a comment is identified as having "high intent," it is automatically flagged and aggregated into quantifiable reporting dimensions.
What does this mean? It means that for the first time, we have a directly readable number to answer the question of "how many potential inquiries were generated by social media last month," instead of relying on operational memory and experience to estimate.
Step 3: Transform data reports from manual compilation to one-click export.
The task of compiling reports steals more than 12 hours from operations every month. These 12 hours could have been used for topic selection, scriptwriting, and user interaction—work that truly impacts content quality.
Once the data has been aggregated in the system, generating reports should be a breeze. SocialEcho supports exporting Excel reports by custom time ranges and custom content dimensions, allowing operations teams to flexibly configure the data based on the metrics that the boss cares about—whether to look at exposure and interaction alone, follower growth trends, or comparative data across different platforms, all fields can be selected during export.
At the same time, the system will automatically collect the published content and output a "Most Popular Content Ranking". When reporting, the operations team can not only say "We published 32 pieces of content last month", but also "These 5 pieces have the highest interaction rate and their common feature is..." - This is the content insight that the boss really wants, not a bunch of raw numbers.
That story about "tidying things up" should be over.
Let's reimagine that Monday meeting room scene.
The boss asked, "How many inquiries did TikTok and Instagram bring in last month?"
This time, you open SocialEcho, switch to the time frame of last month, and the data from four platforms is displayed on the same screen. You point to the screen and say, "Last month, there were a total of 830,000 impressions and 21,000 interactions. Among them, 347 comments were identified by AI as inquiries and purchase intentions, mainly from Instagram and TikTok, accounting for 54% and 38% respectively. The content with the highest interaction rate was these three product demonstration videos, with an average interaction rate 2.3 times the average level of the same period."
The boss nodded. The meeting continued.
This time, you didn't say "tidy it up".
This isn't because you suddenly became smarter, nor because you worked overtime last night to prepare the data in advance—it's because the answer to this question is now being maintained automatically by the system, and can be accessed and reported at any time.
This is the capability that social media teams of brands going global truly need: not just "being able to create good content," but also "being able to clearly explain what they have done."
In conclusion: The ROI of social media investment can be quantified.
Many brands going global invest heavily in social media – human resources, content creation, and advertising – which can add up to tens to hundreds of thousands of RMB per month. But when asked, "What has this money brought?" the answers are often unquantifiable statements like "increased brand exposure" or "significant increase in followers."
This isn't an operational issue; it's a problem of inadequate data infrastructure.
When you can answer "from which content did the 347 intended comments last month come?", when you can answer "Instagram's interaction cost is 34% lower than TikTok's", when you can answer "the most popular content type is product showcase rather than brand story"—at this point, social media operations are no longer a cost center with unclear value, but a growth engine supported by data.
All of this started simply by putting data scattered across five platforms into one place, plus an AI system that can recognize user intent.
Next time your boss asks, you don't need to say "tidy it up".
Regarding SocialEcho
SocialEcho is a multi-platform social media management tool designed specifically for brands going global, covering eight major platforms including TikTok, Instagram, Facebook, LinkedIn, YouTube, Pinterest, Twitter/X, and more. Core features include real-time aggregation of data from multiple accounts, AI-powered user intent recognition, content performance analysis, and custom report export, helping overseas social media teams of 1-5 people shift from "operating by intuition" to "using data to speak." Learn more: Data Analysis | Interaction Management
;}.cls-2{fill:%230868f7;}.cls-3{fill:url(%23未命名的渐变_44);}.cls-4{fill:%23333;}%3c/style%3e%3clinearGradient%20id='未命名的渐变_8'%20x1='33.73'%20y1='100.61'%20x2='-0.03'%20y2='-1.06'%20gradientUnits='userSpaceOnUse'%3e%3cstop%20offset='0'%20stop-color='%237ae9fb'/%3e%3cstop%20offset='0.67'%20stop-color='%232b90f8'/%3e%3cstop%20offset='1'%20stop-color='%230868f7'/%3e%3c/linearGradient%3e%3clinearGradient%20id='未命名的渐变_44'%20x1='27.86'%20y1='18.67'%20x2='68.36'%20y2='22.22'%20gradientUnits='userSpaceOnUse'%3e%3cstop%20offset='0'%20stop-color='%235ac7f2'/%3e%3cstop%20offset='1'%20stop-color='%230868f7'/%3e%3c/linearGradient%3e%3c/defs%3e%3cpath%20class='cls-1'%20d='M29,28.74V81.91l-9.51-3.68v0L8.52,74A7.17,7.17,0,0,1,4,67.32V24.54A3.76,3.76,0,0,1,9.08,21Z'/%3e%3cpath%20class='cls-2'%20d='M68.09,78.07a13.15,13.15,0,0,1-17.9,12.06L29,81.91h0V28.74L50.19,37A13.17,13.17,0,0,0,68.08,25.3h0Z'/%3e%3cpath%20class='cls-3'%20d='M68.08,25.3a13.19,13.19,0,0,1-6.73,10.87A13.09,13.09,0,0,1,50.19,37L29,28.74V6A3.76,3.76,0,0,1,34.1,2.52l25.59,9.91A13.22,13.22,0,0,1,68.08,25.3Z'/%3e%3cpath%20class='cls-4'%20d='M129.06,81.76a4.33,4.33,0,0,1-3.19-1.31,4.4,4.4,0,0,1-1.31-3.24V56.86H97.65V77.21a4.36,4.36,0,0,1-1.35,3.2A4.68,4.68,0,0,1,93,81.76a4.32,4.32,0,0,1-3.19-1.31,4.37,4.37,0,0,1-1.32-3.24V27.27A4.58,4.58,0,0,1,89.83,24a4.59,4.59,0,0,1,7.82,3.27V48.15h26.91V27.27A4.58,4.58,0,0,1,125.91,24a4.59,4.59,0,0,1,7.82,3.27V77.21a4.37,4.37,0,0,1-1.36,3.2A4.65,4.65,0,0,1,129.06,81.76Z'/%3e%3cpath%20class='cls-4'%20d='M163.77,81.66c-6.57,0-11.76-1.92-15.44-5.7s-5.54-9.07-5.54-15.74a26.76,26.76,0,0,1,2.09-10.43,17.72,17.72,0,0,1,6.67-8.06,19.15,19.15,0,0,1,10.68-2.95,19,19,0,0,1,10.46,2.8,18.7,18.7,0,0,1,6.55,7.36,22.53,22.53,0,0,1,2.36,10.28A4.51,4.51,0,0,1,177,63.77H152.23a10.8,10.8,0,0,0,3.49,6.65c2,1.68,4.88,2.52,8.66,2.52a22.25,22.25,0,0,0,7.54-1.21c.74-.3,1.55-.67,2.37-1.07a3.75,3.75,0,0,1,1.84-.4,4.09,4.09,0,0,1,3,1.15,4,4,0,0,1,1.12,3,4.38,4.38,0,0,1-2.58,3.82,32.34,32.34,0,0,1-6.36,2.61A28.67,28.67,0,0,1,163.77,81.66ZM172.4,55.9a9.72,9.72,0,0,0-1.63-4.56A9.9,9.9,0,0,0,167,48a10.38,10.38,0,0,0-4.64-1.14,12,12,0,0,0-4.77,1.06,9.54,9.54,0,0,0-4.89,5.66,11.78,11.78,0,0,0-.51,2.3Z'/%3e%3cpath%20class='cls-4'%20d='M193,81.64a4.49,4.49,0,0,1-4.51-4.55V27.28A4.58,4.58,0,0,1,189.84,24a4.48,4.48,0,0,1,3.28-1.36A4.36,4.36,0,0,1,196.35,24a4.46,4.46,0,0,1,1.31,3.31V77.09a4.34,4.34,0,0,1-1.35,3.2A4.67,4.67,0,0,1,193,81.64Z'/%3e%3cpath%20class='cls-4'%20d='M263.79,81.71a5.7,5.7,0,0,1-4.2-1.74,5.76,5.76,0,0,1-1.73-4.19V27.37a4.58,4.58,0,0,1,1.35-3.27A4.59,4.59,0,0,1,267,27.37V72.53h24a4.58,4.58,0,0,1,3.27,7.82A4.66,4.66,0,0,1,291,81.71Z'/%3e%3cpath%20class='cls-4'%20d='M424.48,81.74a4.71,4.71,0,0,1-2.71-.88,5.43,5.43,0,0,1-1-1l-.07-.09-12.41-17-5.41,5v9.44a4.31,4.31,0,0,1-1.36,3.19,4.66,4.66,0,0,1-3.3,1.36A4.29,4.29,0,0,1,395,80.42a4.36,4.36,0,0,1-1.32-3.23V27.37A4.58,4.58,0,0,1,395,24.1a4.52,4.52,0,0,1,6.58.12,4.54,4.54,0,0,1,1.24,3.15V56.31l17.72-16.38.05,0a4.8,4.8,0,0,1,2.94-1.11,4.4,4.4,0,0,1,3.27,1.2,4.57,4.57,0,0,1,1.2,3.27,4.44,4.44,0,0,1-.77,2.33,7.45,7.45,0,0,1-1.43,1.65l-11,9.64,13.34,17.68a5,5,0,0,1,1,2.71,4.12,4.12,0,0,1-1.36,3.24A4.64,4.64,0,0,1,424.48,81.74Z'/%3e%3cpath%20class='cls-4'%20d='M317.93,81.76a21.5,21.5,0,1,1,21.17-21.5A21.37,21.37,0,0,1,317.93,81.76Zm0-34.1a12.61,12.61,0,1,0,12.42,12.6A12.52,12.52,0,0,0,317.93,47.66Z'/%3e%3cpath%20class='cls-4'%20d='M212.18,101.22a4.12,4.12,0,0,1-3.05-1.26,4.17,4.17,0,0,1-1.26-3.1V43.34a4.37,4.37,0,0,1,1.3-3.14,4.26,4.26,0,0,1,3.13-1.3,4.19,4.19,0,0,1,3.1,1.26,4.32,4.32,0,0,1,1.26,3.16,20.77,20.77,0,0,1,13-4.54,21.51,21.51,0,0,1,0,43,20.51,20.51,0,0,1-13-4.57V96.86a4.15,4.15,0,0,1-1.3,3.06A4.5,4.5,0,0,1,212.18,101.22Zm17.43-53.63c-6.23,0-12.93,4.11-12.93,12.72a12.73,12.73,0,0,0,25.46,0A12.71,12.71,0,0,0,229.61,47.59Z'/%3e%3cpath%20class='cls-4'%20d='M365.76,81.76a21.5,21.5,0,1,1,21.18-21.5A21.37,21.37,0,0,1,365.76,81.76Zm0-34.1a12.61,12.61,0,1,0,12.42,12.6A12.52,12.52,0,0,0,365.76,47.66Z'/%3e%3c/svg%3e)