The boss demands weekly reports, and you're still manually taking screenshots and piecing together data—the real dilemma faced by brand operations teams across 5 platforms.
The boss demands weekly reports, and you're still manually taking screenshots and piecing together data—the real dilemma faced by brand operations teams across 5 platforms.

Thursday afternoon at four o'clock, that familiar nightmare returned.
"There's a meeting tomorrow, and I need a summary of data from all platforms this week. Send it to me before 8 PM."
After your boss sent this WeChat message, you stared at the screen for three seconds, then took a deep breath and opened your browser.
First, Instagram. You log in, find Insights, and take screenshots—three charts: follower growth, reach, and engagement rate—in three separate screenshots because they won't fit on one screen. Then TikTok follows the same process, but TikTok's "view completion rate" and Instagram's "reach" are completely different metrics; you need to manually convert them in the accompanying Excel spreadsheet. Next, Facebook counts follower growth as "net growth," which differs from Instagram's "new additions" metrics; you need to check last week's data and calculate the difference.
LinkedIn hasn't launched yet, and YouTube hasn't been touched.
There are still four hours until 8 p.m.
This isn't an occasional overtime scenario. For a brand operations team managing 5 to 8 social media accounts, this is almost a weekly ordeal. You open a dozen tabs, switch between different backends, copy numbers into spreadsheets, find the formatting is wrong and adjust it, take screenshots to put into PowerPoint, and find the resolution is inconsistent. Going through the whole process takes at least four hours.
What's even more ironic is that what you did has absolutely no brand value.
This is not just your problem, but a systemic predicament for the entire industry.
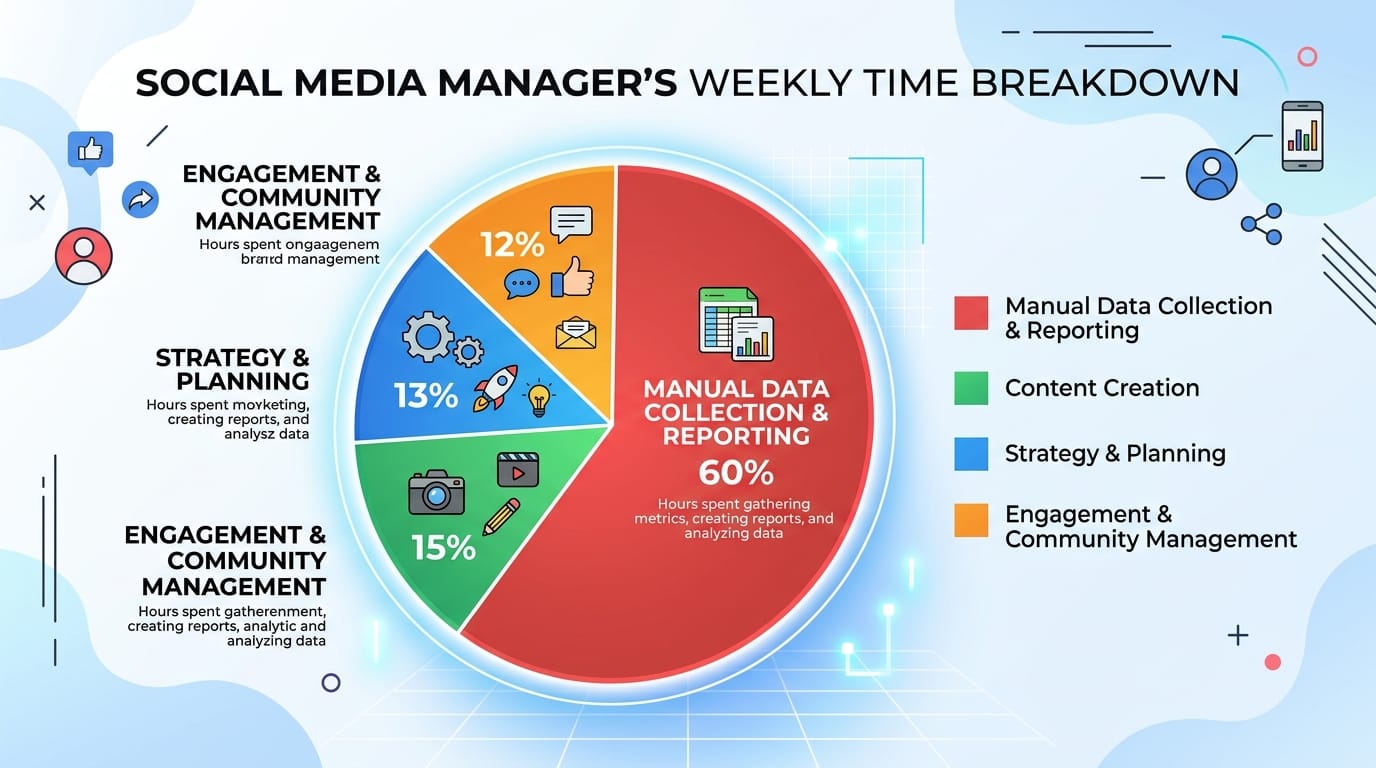
You might think your team isn't efficient enough, or you're not proficient enough with the tools. But HubSpot's "2025 State of Social Media Marketing Report" reveals a harsh industry truth: over 60% of social media operators say they spend more than 5 hours a week on data processing and report generation, almost entirely repetitive work that doesn't generate any strategic value. Sprout Social's research is even more direct—enterprise social media teams manage an average of 3.7 platforms, and cross-platform data integration is listed as the "most time-consuming and frustrating" task in operations, ranking first.
The logic behind the numbers is actually quite simple: each platform is an independent business ecosystem, and they have neither the obligation nor the incentive to make things easier for you. Instagram wants you to spend more time on its platform, so it shows you the data but doesn't export it; TikTok's algorithm is completely different from Facebook's, and their standards for measuring "success" are inherently different. The data integration challenge you face isn't because a product manager forgot to add a feature, but rather an inevitable result of the platform's business model design. The walls surrounding each platform are deliberately built.
What does this mean? It means that no matter how many tricks you use or how proficient you are at using keyboard shortcuts, if the platform itself does not open a unified interface, the upper limit of manually piecing together data is "to do something meaningless faster".
While you're engrossed in this meaningless task, you're completely unaware of what's happening in the outside world.
Your competitor posted a video on Instagram today, and within two hours the comments section exploded. Users were asking about a need your product can also fulfill but has never advertised. You don't know this because you're taking screenshots. Your target audience is currently enjoying a trending hashtag on TikTok that's highly relevant to your product, and it's gaining traction quickly—a good time to enter the market. You don't know this because you're doing differential calculations. One of your posts had exceptionally good data last Tuesday; the algorithm might have been recommending it to a new audience, making it worthwhile to reinvest. You don't know this because you're adjusting your PowerPoint presentation format.
This is the true nature of opportunity cost: you're not just wasting time, you're using time that could be used to seize opportunities to complete a task with zero output.
The deeper issue is that content marketing in 2026 has entered a new quality-driven phase. Algorithms are becoming increasingly sophisticated, and users are becoming more discerning. A single well-planned and meticulously crafted piece of content can deliver results that ten mediocre pieces combined couldn't achieve in the past. HubSpot's report also indicates that by 2025, over 70% of brands had realized that "content quality" was more important than "posting frequency" and were beginning to reduce the number of posts while increasing investment in each individual piece of content.
The reality is that when your team spends a lot of energy on repetitive tasks like data processing, the time actually devoted to researching topics, refining copy, and analyzing user feedback is squeezed out. This is a form of slow, persistent loss: the team appears busy on the surface, but the real value of their output is quietly declining.
Step outside this framework: the question isn't "how to organize faster".
When faced with this problem, many teams' first reaction is to "optimize the process"—create a better Excel template, find a faster screenshot tool, or train new employees to share the workload. These methods may have some effect in the short term, but they don't address the root of the problem.
The fundamental problem is not "how to organize faster", but "there is no need to organize at all".
The real solution is to automatically aggregate data in one place, rather than having people chase after it. In practical terms, this translates to a unified data dashboard across multiple platforms: all the social media accounts you manage have their data synchronized in real time, without needing to log into each platform, manually take screenshots, or perform interpolation calculations—the dashboard directly provides the data you need.
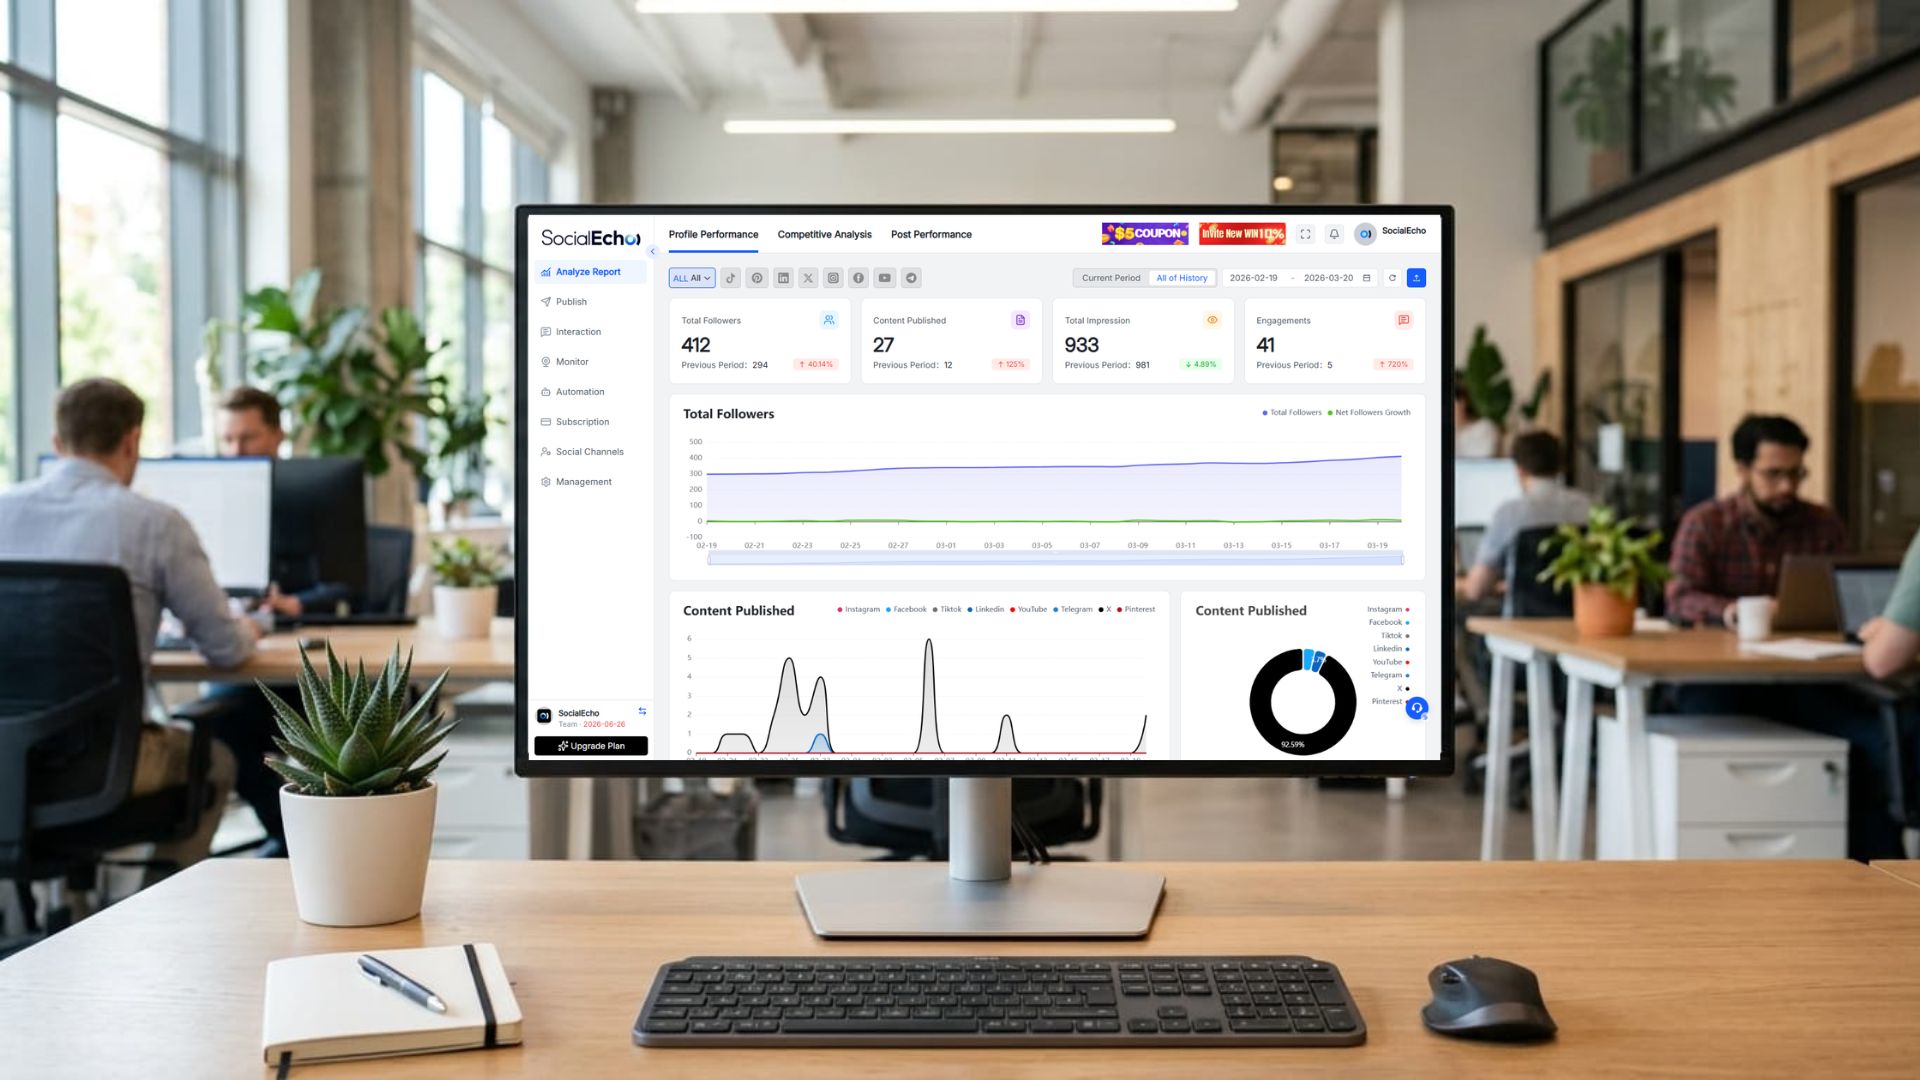
Imagine this scenario compared to the previous one: Your boss sends you the same message this afternoon. You open your SocialEcho data analytics dashboard , and the data for this week from all platforms is already compiled. Follower growth, content engagement, and reach are all presented in a consistent format, along with trend line charts. You select the time range, click "Export to Excel," and a neatly formatted data report appears. The whole process takes less than ten minutes.
What did you do with the remaining three hours and fifty minutes? You spent time looking at the three best-performing content pieces from your competitors this week, analyzing their comment sections, and discovering a pain point that users kept mentioning. You then incorporated this insight into next week's content plan. You checked your own content data and found that the video you posted on Tuesday had an unusually high engagement rate. Upon further investigation, you discovered that the background music had caught a rising trend, so you flagged this signal and planned to reuse it next week.
This is what an operations person should do.
How does SocialEcho solve this problem?
SocialEcho's multi-platform monitoring feature covers eight major platforms: Facebook, Instagram, Twitter, LinkedIn, Telegram, YouTube, TikTok, and Pinterest. Data from all accounts is presented in real-time on a single interface, eliminating the need to switch between different backends. Data is granular down to each day and retains 180 days of historical records, meaning you can not only view this week's performance but also make trend comparisons across months and quarters.
When reports are needed, the data export function supports custom time ranges and indicator dimensions, generating Excel files with a single click. The format is consistent and the data is accurate, ready to be sent directly to your boss or clients. You no longer need to manually adjust the format or worry about screenshot resolution.
In addition to its own account data, SocialEcho also supports automatic monitoring and data scraping of competitor accounts—what content the other party posts, how their interaction data is, and what their fan trends are. You can see this information in real time on your own dashboard, instead of having to manually browse competitor homepages periodically.
For a small brand operations team of 1 to 3 people, the efficiency improvement brought by this tool is not 50%, but a structural re-division of labor: data processing is transformed from a labor-intensive task into an automated output with zero marginal cost, freeing up time and energy that can be fully devoted to content strategy, creative execution, and competitor insights.
FAQ: Three questions the operations team would actually ask
Q1: We are quite comfortable using Excel to manually compile statistics now. Is the learning cost of switching tools high?
This is the most common concern. In reality, multi-platform data dashboards have a very low barrier to entry because they don't require you to learn any new data logic—they simply automate the data you used to collect manually, with a visual interface that requires no technical background. Typically, a team member can get started in under 30 minutes. The real learning cost is actually the habit of "stopping working the old way," not the tool itself.
Q2: Different platforms use different data standards. Can a unified dashboard be accurate?
This is a highly technical question, and it's why many teams give up on finding a unified tool. There are indeed differences in terminology across platforms—Instagram measures "reach" differently than TikTok, and Facebook's definition of "interaction" includes different types of behavior than other platforms. Good data tools will connect to the official APIs of each platform at the data source level, presenting data according to each platform's own statistical standards, and clearly labeling the definition of each metric on the interface, rather than inventing a cross-platform "unified standard" and forcibly aligning it. What you need to do is understand the original meaning of each platform's metrics, rather than believing that any tool can make "reach" completely equivalent across different platforms.
Q3: My boss wants some special indicators in the report. Can the unified tool support customization?
This depends on the flexibility of the tool. SocialEcho allows you to customize the time range and key metrics when exporting reports. If the metrics you need are standard data provided by the official APIs of various platforms, they can generally be included. For some highly customized reporting needs (such as specific chart styles or brand design guidelines), the exported Excel file can be further edited and adjusted locally, and the data itself is already accurate and uniformly formatted, which saves the most time-consuming part of the entire process.
Efficiency isn't innate; it's designed. If your team is still spending hours each week taking screenshots and piecing together tables, it's not a problem with the team's capabilities, but rather with the workflow design. Solving this problem is far less costly than you might imagine.
Try SocialEcho for free now → https://www.socialecho.net
;}.cls-2{fill:%230868f7;}.cls-3{fill:url(%23未命名的渐变_44);}.cls-4{fill:%23333;}%3c/style%3e%3clinearGradient%20id='未命名的渐变_8'%20x1='33.73'%20y1='100.61'%20x2='-0.03'%20y2='-1.06'%20gradientUnits='userSpaceOnUse'%3e%3cstop%20offset='0'%20stop-color='%237ae9fb'/%3e%3cstop%20offset='0.67'%20stop-color='%232b90f8'/%3e%3cstop%20offset='1'%20stop-color='%230868f7'/%3e%3c/linearGradient%3e%3clinearGradient%20id='未命名的渐变_44'%20x1='27.86'%20y1='18.67'%20x2='68.36'%20y2='22.22'%20gradientUnits='userSpaceOnUse'%3e%3cstop%20offset='0'%20stop-color='%235ac7f2'/%3e%3cstop%20offset='1'%20stop-color='%230868f7'/%3e%3c/linearGradient%3e%3c/defs%3e%3cpath%20class='cls-1'%20d='M29,28.74V81.91l-9.51-3.68v0L8.52,74A7.17,7.17,0,0,1,4,67.32V24.54A3.76,3.76,0,0,1,9.08,21Z'/%3e%3cpath%20class='cls-2'%20d='M68.09,78.07a13.15,13.15,0,0,1-17.9,12.06L29,81.91h0V28.74L50.19,37A13.17,13.17,0,0,0,68.08,25.3h0Z'/%3e%3cpath%20class='cls-3'%20d='M68.08,25.3a13.19,13.19,0,0,1-6.73,10.87A13.09,13.09,0,0,1,50.19,37L29,28.74V6A3.76,3.76,0,0,1,34.1,2.52l25.59,9.91A13.22,13.22,0,0,1,68.08,25.3Z'/%3e%3cpath%20class='cls-4'%20d='M129.06,81.76a4.33,4.33,0,0,1-3.19-1.31,4.4,4.4,0,0,1-1.31-3.24V56.86H97.65V77.21a4.36,4.36,0,0,1-1.35,3.2A4.68,4.68,0,0,1,93,81.76a4.32,4.32,0,0,1-3.19-1.31,4.37,4.37,0,0,1-1.32-3.24V27.27A4.58,4.58,0,0,1,89.83,24a4.59,4.59,0,0,1,7.82,3.27V48.15h26.91V27.27A4.58,4.58,0,0,1,125.91,24a4.59,4.59,0,0,1,7.82,3.27V77.21a4.37,4.37,0,0,1-1.36,3.2A4.65,4.65,0,0,1,129.06,81.76Z'/%3e%3cpath%20class='cls-4'%20d='M163.77,81.66c-6.57,0-11.76-1.92-15.44-5.7s-5.54-9.07-5.54-15.74a26.76,26.76,0,0,1,2.09-10.43,17.72,17.72,0,0,1,6.67-8.06,19.15,19.15,0,0,1,10.68-2.95,19,19,0,0,1,10.46,2.8,18.7,18.7,0,0,1,6.55,7.36,22.53,22.53,0,0,1,2.36,10.28A4.51,4.51,0,0,1,177,63.77H152.23a10.8,10.8,0,0,0,3.49,6.65c2,1.68,4.88,2.52,8.66,2.52a22.25,22.25,0,0,0,7.54-1.21c.74-.3,1.55-.67,2.37-1.07a3.75,3.75,0,0,1,1.84-.4,4.09,4.09,0,0,1,3,1.15,4,4,0,0,1,1.12,3,4.38,4.38,0,0,1-2.58,3.82,32.34,32.34,0,0,1-6.36,2.61A28.67,28.67,0,0,1,163.77,81.66ZM172.4,55.9a9.72,9.72,0,0,0-1.63-4.56A9.9,9.9,0,0,0,167,48a10.38,10.38,0,0,0-4.64-1.14,12,12,0,0,0-4.77,1.06,9.54,9.54,0,0,0-4.89,5.66,11.78,11.78,0,0,0-.51,2.3Z'/%3e%3cpath%20class='cls-4'%20d='M193,81.64a4.49,4.49,0,0,1-4.51-4.55V27.28A4.58,4.58,0,0,1,189.84,24a4.48,4.48,0,0,1,3.28-1.36A4.36,4.36,0,0,1,196.35,24a4.46,4.46,0,0,1,1.31,3.31V77.09a4.34,4.34,0,0,1-1.35,3.2A4.67,4.67,0,0,1,193,81.64Z'/%3e%3cpath%20class='cls-4'%20d='M263.79,81.71a5.7,5.7,0,0,1-4.2-1.74,5.76,5.76,0,0,1-1.73-4.19V27.37a4.58,4.58,0,0,1,1.35-3.27A4.59,4.59,0,0,1,267,27.37V72.53h24a4.58,4.58,0,0,1,3.27,7.82A4.66,4.66,0,0,1,291,81.71Z'/%3e%3cpath%20class='cls-4'%20d='M424.48,81.74a4.71,4.71,0,0,1-2.71-.88,5.43,5.43,0,0,1-1-1l-.07-.09-12.41-17-5.41,5v9.44a4.31,4.31,0,0,1-1.36,3.19,4.66,4.66,0,0,1-3.3,1.36A4.29,4.29,0,0,1,395,80.42a4.36,4.36,0,0,1-1.32-3.23V27.37A4.58,4.58,0,0,1,395,24.1a4.52,4.52,0,0,1,6.58.12,4.54,4.54,0,0,1,1.24,3.15V56.31l17.72-16.38.05,0a4.8,4.8,0,0,1,2.94-1.11,4.4,4.4,0,0,1,3.27,1.2,4.57,4.57,0,0,1,1.2,3.27,4.44,4.44,0,0,1-.77,2.33,7.45,7.45,0,0,1-1.43,1.65l-11,9.64,13.34,17.68a5,5,0,0,1,1,2.71,4.12,4.12,0,0,1-1.36,3.24A4.64,4.64,0,0,1,424.48,81.74Z'/%3e%3cpath%20class='cls-4'%20d='M317.93,81.76a21.5,21.5,0,1,1,21.17-21.5A21.37,21.37,0,0,1,317.93,81.76Zm0-34.1a12.61,12.61,0,1,0,12.42,12.6A12.52,12.52,0,0,0,317.93,47.66Z'/%3e%3cpath%20class='cls-4'%20d='M212.18,101.22a4.12,4.12,0,0,1-3.05-1.26,4.17,4.17,0,0,1-1.26-3.1V43.34a4.37,4.37,0,0,1,1.3-3.14,4.26,4.26,0,0,1,3.13-1.3,4.19,4.19,0,0,1,3.1,1.26,4.32,4.32,0,0,1,1.26,3.16,20.77,20.77,0,0,1,13-4.54,21.51,21.51,0,0,1,0,43,20.51,20.51,0,0,1-13-4.57V96.86a4.15,4.15,0,0,1-1.3,3.06A4.5,4.5,0,0,1,212.18,101.22Zm17.43-53.63c-6.23,0-12.93,4.11-12.93,12.72a12.73,12.73,0,0,0,25.46,0A12.71,12.71,0,0,0,229.61,47.59Z'/%3e%3cpath%20class='cls-4'%20d='M365.76,81.76a21.5,21.5,0,1,1,21.18-21.5A21.37,21.37,0,0,1,365.76,81.76Zm0-34.1a12.61,12.61,0,1,0,12.42,12.6A12.52,12.52,0,0,0,365.76,47.66Z'/%3e%3c/svg%3e)