One Data Dashboard: 20 More Leads/Month
One Data Dashboard That Helps Your Team Generate 20 More Leads Per Month
Have you calculated how much time your operations team "wastes" on data every day?
9 AM. You open your computer. Instead of creating content or talking to customers, you—log into Facebook Business Manager to check yesterday's post data; then open Instagram Insights, copy and paste; then TikTok Creator Center, LinkedIn Page Analytics... By the time you've screenshot all platform data and filled in the spreadsheet, it's already 11 AM.
And that's not all. 4 PM. Your boss suddenly asks: "How's lead conversion across platforms this month?"
You take a deep breath and start scrambling to consolidate—only to discover some data is from last week, some formats don't match at all, and you have to log into each platform again.
This isn't a capability problem. It's a tool problem.
Today, I want to tell you: A unified data dashboard can help your operations team generate 20 more leads per month. This isn't theoretical—it's calculated based on real operational scenarios.
The Data Dilemma of Operations Teams: Time Spent, No Revenue Seen
Operations teams for 出海 brands share a common trait: Many platforms, scattered data, all time spent on consolidation.
You might be managing Facebook, Instagram, TikTok, X, LinkedIn—each with its own analytics backend. Looking at each platform individually, the data looks great—this post has 5K impressions, that video has 10K views. But the question is: Which platform, which content, actually brought you leads?
Most operations teams answer: We don't know.
The reason is simple: Impressions and engagement are platform metrics; leads are your metrics. If you don't connect these two layers of data, you'll always be "looking at data" instead of "using data."
What's more painful: many operations teams spend at least 2-3 hours daily on data consolidation. That's 10-15 hours per week, 40-60 hours per month—equivalent to a full week of full-time work, just for screenshots, spreadsheets, and number matching.
If that time was used for developing customers, following up leads, optimizing scripts—how many more orders could you convert?
The Three Costs of Scattered Data: Every One Is Real Money
Cost One: Missing Business Opportunity Windows
User decision windows on social media are short. Research shows that if users don't get a response within 24 hours after showing engagement intent on social platforms, the probability of converting to leads drops by over 60%.
But think about it: when comments and DMs are scattered across 5 platform backends, can your team guarantee they'll see and respond to each platform immediately?
Most of the time, the answer is "no." Not because they don't want to—they genuinely can't keep up.
Cost Two: Content Strategy by Guess, Not by Data
Does your team have those "I feel this will go viral" brainstorming sessions?
If yes, that's a dangerous signal. Truly effective content strategy should be data-driven: which topics have high engagement rates, which time slots have active followers, which content types have the most active comment sections, which platform has the shortest follower conversion path... String these data together, and you have the scientific basis for content strategy.
But if your data is scattered, delayed, and inconsistently formatted, you can't do this cross-platform analysis. The result—content teams go by feel, success depends on luck.
Cost Three: Reporting Is Always "Homework Submission," Not "Communication"
Many operations people habitually list a bunch of impressions, likes, and follower growth when reporting to their boss. But the boss really wants to know only one question: Did these actions make money for the company?
When you can't provide a complete data chain from impressions to leads, from leads to conversions, your reporting becomes "homework submission"—completed, but no value.
One Dashboard, Three Problems Solved
SocialEcho's Analytics is designed for this scenario: Consolidate scattered data into a unified dashboard, transforming your team from "data viewers" to "data users".
How? Three steps.
Step One: Connect Once, Sync Continuously
You no longer need to log into each platform backend. SocialEcho connects via official APIs to Facebook, Instagram, TikTok, X, LinkedIn, YouTube, Telegram, Pinterest—8 major platforms, automatically syncing key data.
Importantly, this is direct official API connection—account security, no bans, real-time data updates—not next-day screenshots, but data happening right now.
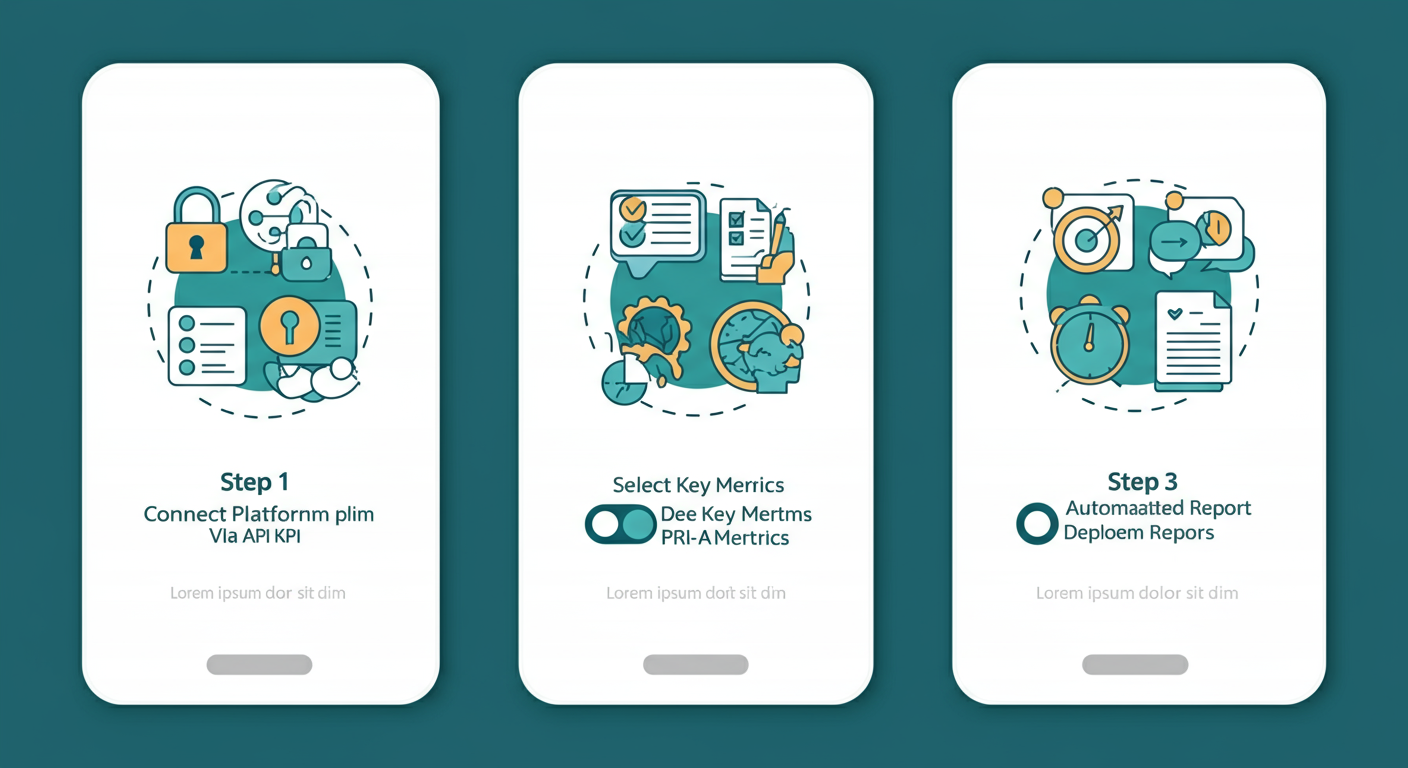
Step Two: Choose Metrics You Want, Not Metrics Platforms Give You
The metrics each platform backend gives you are what the platform wants you to see—impressions, reach, engagement. These are "vanity" metrics.
The truly valuable "substance" metrics are: which posts drove comments, which comments are potential customer leads, which platform has the lowest cost per engagement, which content type has the shortest follower conversion path.
SocialEcho's dashboard supports custom metric panels—you can put the most important metrics for your team together, no longer held hostage by platform data structures.
Step Three: Auto-Generate Reports, You Make the Decisions
Monday operations meeting—you need a data report. Previously, this report required 2-3 hours of manual consolidation.
Now, SocialEcho can auto-generate reports at set times, pushing to your email or work group. The report contains complete cross-platform data comparisons: this week vs last week, this month vs last month—all the changes you want to see, at a glance.
Your team's time should be spent interpreting data and making decisions, not consolidating data.
20 More Leads Per Month—How Is That Calculated?
You might ask: Where does the number 20 come from?
We did a calculation assuming a 3-person operations team managing 5 platform accounts:
| Scenario | Traditional Way | After Data Dashboard |
|---|---|---|
| Daily Data Consolidation Time | 2.5 hours | 15 minutes (95% reduction) |
| Weekly Time Saved | 12.5 hours | — |
| Monthly Time Saved | 50 hours | — |
| Response Speed | Avg 4-6 hours | Avg 1-2 hours |
| Lead Response Rate | ~35% | ~65% |
| Assumed Lead Base | 50/month | 70/month |
| Incremental Leads | — | +20/month |
The core logic: when your team no longer spends time on screenshots and spreadsheets, you have more time for two things—quickly responding to every potential lead, and optimizing content strategy based on data.
Faster response means more leads are followed up timely, not lost. Content strategy optimization means subsequent posts are higher quality, bringing more organic leads. Combined, the effect isn't additive—it's multiplicative.
For a B2B 出海 brand, 20 new leads could mean tens or hundreds of thousands in GMV. Calculate that ROI yourself and you'll know if it's worth it.

From "Data Slave" to "Data Owner": Mindset Upgrade Matters More Than Tools
What tools can solve is limited; what mindset upgrades can change is infinite.
I've seen many teams spend big money on data tools but still spend 3 hours daily on manual screenshots—because they didn't change their workflows. The data tool just became another "backup data source" instead of replacing the old inefficient process.
So while deploying a data dashboard, I recommend your team do a workflow "decluttering":
First, set "read-only time" for data reporting. For example, 9-10 AM daily is fixed data consolidation time; other times, don't actively refresh each platform backend. Focus attention on what truly matters.
Second, establish data-driven weekly meeting mechanisms. Every Monday, use cross-platform comparison data from the dashboard for a brief strategy alignment meeting. Not competing on who has prettier data, but who found growth opportunities.
Third, put the data dashboard on a public screen. Let every team member see overall data status anytime, not just the person in charge knowing where the data is while others are in the dark.
A data dashboard isn't just a display tool—it's the common language of team collaboration.
FAQ
Q1: Which platforms does SocialEcho Analytics support?
Supports 8 major platforms: Facebook, Instagram, TikTok, X (Twitter), LinkedIn, YouTube, Telegram, Pinterest—via official API connections, real-time data sync.
Q2: I already have another analytics tool, do I still need SocialEcho?
SocialEcho's core advantage is "data + engagement" integration. Other tools might only do data display, while SocialEcho's analytics seamlessly integrates with Comment Management, Competitor Monitoring, Bulk Publishing—when you see data anomalies, you can respond directly in the same platform without switching tools.
Q3: Is data sync real-time? Will there be delays?
Via official API connections, data delays are typically within minutes. Each platform has its own API data refresh cycles; SocialEcho syncs as close to real-time as possible, subject to each platform's official API.
Q4: My team has multiple people, does it support permission management?
Yes. SocialEcho Team Edition provides multi-member collaboration features, with different roles' data view and operation permissions—suitable for enterprise brand departments and agency teams.
Q5: Is data export convenient? What formats are supported?
Supports export to Excel, CSV, and other common formats for further internal analysis or client reports. Auto-report features can also push to designated emails at set times, eliminating manual consolidation.
Finally
The efficiency gap between operations teams often isn't about who works harder, but whose tools are smarter.
A data dashboard solves not just the "can't see data" problem, but the "use data to drive growth" problem. When you no longer need to spend 3 hours daily consolidating data, you have real time to think: which content is driving leads, which platform has the highest user conversion rate, how should the next content strategy be adjusted.
These are what truly help you generate 20 more leads per month.
7-day free trial, no credit card required. If you want to see what changes SocialEcho's data dashboard can bring to your team, you can start now.
;}.cls-2{fill:%230868f7;}.cls-3{fill:url(%23未命名的渐变_44);}.cls-4{fill:%23333;}%3c/style%3e%3clinearGradient%20id='未命名的渐变_8'%20x1='33.73'%20y1='100.61'%20x2='-0.03'%20y2='-1.06'%20gradientUnits='userSpaceOnUse'%3e%3cstop%20offset='0'%20stop-color='%237ae9fb'/%3e%3cstop%20offset='0.67'%20stop-color='%232b90f8'/%3e%3cstop%20offset='1'%20stop-color='%230868f7'/%3e%3c/linearGradient%3e%3clinearGradient%20id='未命名的渐变_44'%20x1='27.86'%20y1='18.67'%20x2='68.36'%20y2='22.22'%20gradientUnits='userSpaceOnUse'%3e%3cstop%20offset='0'%20stop-color='%235ac7f2'/%3e%3cstop%20offset='1'%20stop-color='%230868f7'/%3e%3c/linearGradient%3e%3c/defs%3e%3cpath%20class='cls-1'%20d='M29,28.74V81.91l-9.51-3.68v0L8.52,74A7.17,7.17,0,0,1,4,67.32V24.54A3.76,3.76,0,0,1,9.08,21Z'/%3e%3cpath%20class='cls-2'%20d='M68.09,78.07a13.15,13.15,0,0,1-17.9,12.06L29,81.91h0V28.74L50.19,37A13.17,13.17,0,0,0,68.08,25.3h0Z'/%3e%3cpath%20class='cls-3'%20d='M68.08,25.3a13.19,13.19,0,0,1-6.73,10.87A13.09,13.09,0,0,1,50.19,37L29,28.74V6A3.76,3.76,0,0,1,34.1,2.52l25.59,9.91A13.22,13.22,0,0,1,68.08,25.3Z'/%3e%3cpath%20class='cls-4'%20d='M129.06,81.76a4.33,4.33,0,0,1-3.19-1.31,4.4,4.4,0,0,1-1.31-3.24V56.86H97.65V77.21a4.36,4.36,0,0,1-1.35,3.2A4.68,4.68,0,0,1,93,81.76a4.32,4.32,0,0,1-3.19-1.31,4.37,4.37,0,0,1-1.32-3.24V27.27A4.58,4.58,0,0,1,89.83,24a4.59,4.59,0,0,1,7.82,3.27V48.15h26.91V27.27A4.58,4.58,0,0,1,125.91,24a4.59,4.59,0,0,1,7.82,3.27V77.21a4.37,4.37,0,0,1-1.36,3.2A4.65,4.65,0,0,1,129.06,81.76Z'/%3e%3cpath%20class='cls-4'%20d='M163.77,81.66c-6.57,0-11.76-1.92-15.44-5.7s-5.54-9.07-5.54-15.74a26.76,26.76,0,0,1,2.09-10.43,17.72,17.72,0,0,1,6.67-8.06,19.15,19.15,0,0,1,10.68-2.95,19,19,0,0,1,10.46,2.8,18.7,18.7,0,0,1,6.55,7.36,22.53,22.53,0,0,1,2.36,10.28A4.51,4.51,0,0,1,177,63.77H152.23a10.8,10.8,0,0,0,3.49,6.65c2,1.68,4.88,2.52,8.66,2.52a22.25,22.25,0,0,0,7.54-1.21c.74-.3,1.55-.67,2.37-1.07a3.75,3.75,0,0,1,1.84-.4,4.09,4.09,0,0,1,3,1.15,4,4,0,0,1,1.12,3,4.38,4.38,0,0,1-2.58,3.82,32.34,32.34,0,0,1-6.36,2.61A28.67,28.67,0,0,1,163.77,81.66ZM172.4,55.9a9.72,9.72,0,0,0-1.63-4.56A9.9,9.9,0,0,0,167,48a10.38,10.38,0,0,0-4.64-1.14,12,12,0,0,0-4.77,1.06,9.54,9.54,0,0,0-4.89,5.66,11.78,11.78,0,0,0-.51,2.3Z'/%3e%3cpath%20class='cls-4'%20d='M193,81.64a4.49,4.49,0,0,1-4.51-4.55V27.28A4.58,4.58,0,0,1,189.84,24a4.48,4.48,0,0,1,3.28-1.36A4.36,4.36,0,0,1,196.35,24a4.46,4.46,0,0,1,1.31,3.31V77.09a4.34,4.34,0,0,1-1.35,3.2A4.67,4.67,0,0,1,193,81.64Z'/%3e%3cpath%20class='cls-4'%20d='M263.79,81.71a5.7,5.7,0,0,1-4.2-1.74,5.76,5.76,0,0,1-1.73-4.19V27.37a4.58,4.58,0,0,1,1.35-3.27A4.59,4.59,0,0,1,267,27.37V72.53h24a4.58,4.58,0,0,1,3.27,7.82A4.66,4.66,0,0,1,291,81.71Z'/%3e%3cpath%20class='cls-4'%20d='M424.48,81.74a4.71,4.71,0,0,1-2.71-.88,5.43,5.43,0,0,1-1-1l-.07-.09-12.41-17-5.41,5v9.44a4.31,4.31,0,0,1-1.36,3.19,4.66,4.66,0,0,1-3.3,1.36A4.29,4.29,0,0,1,395,80.42a4.36,4.36,0,0,1-1.32-3.23V27.37A4.58,4.58,0,0,1,395,24.1a4.52,4.52,0,0,1,6.58.12,4.54,4.54,0,0,1,1.24,3.15V56.31l17.72-16.38.05,0a4.8,4.8,0,0,1,2.94-1.11,4.4,4.4,0,0,1,3.27,1.2,4.57,4.57,0,0,1,1.2,3.27,4.44,4.44,0,0,1-.77,2.33,7.45,7.45,0,0,1-1.43,1.65l-11,9.64,13.34,17.68a5,5,0,0,1,1,2.71,4.12,4.12,0,0,1-1.36,3.24A4.64,4.64,0,0,1,424.48,81.74Z'/%3e%3cpath%20class='cls-4'%20d='M317.93,81.76a21.5,21.5,0,1,1,21.17-21.5A21.37,21.37,0,0,1,317.93,81.76Zm0-34.1a12.61,12.61,0,1,0,12.42,12.6A12.52,12.52,0,0,0,317.93,47.66Z'/%3e%3cpath%20class='cls-4'%20d='M212.18,101.22a4.12,4.12,0,0,1-3.05-1.26,4.17,4.17,0,0,1-1.26-3.1V43.34a4.37,4.37,0,0,1,1.3-3.14,4.26,4.26,0,0,1,3.13-1.3,4.19,4.19,0,0,1,3.1,1.26,4.32,4.32,0,0,1,1.26,3.16,20.77,20.77,0,0,1,13-4.54,21.51,21.51,0,0,1,0,43,20.51,20.51,0,0,1-13-4.57V96.86a4.15,4.15,0,0,1-1.3,3.06A4.5,4.5,0,0,1,212.18,101.22Zm17.43-53.63c-6.23,0-12.93,4.11-12.93,12.72a12.73,12.73,0,0,0,25.46,0A12.71,12.71,0,0,0,229.61,47.59Z'/%3e%3cpath%20class='cls-4'%20d='M365.76,81.76a21.5,21.5,0,1,1,21.18-21.5A21.37,21.37,0,0,1,365.76,81.76Zm0-34.1a12.61,12.61,0,1,0,12.42,12.6A12.52,12.52,0,0,0,365.76,47.66Z'/%3e%3c/svg%3e)