
How Many Followers Land You a Brand Deal? Same Follower Count, 3x Price Gap — What Actually Sets KOL Rates
By Wang Lei — covering creator monetization and influencer marketing
Aya and Xiaobei both run beauty-niche accounts, each with roughly 80,000 followers, and their product picks overlap quite a bit. Last month the same brand reached out to both of them for a quote. Aya quoted $420 per post; Xiaobei quoted $125. The brand ended up going with Aya. Xiaobei couldn't wrap her head around it — she actually had about two thousand more followers than Aya, so how did the price come out more than three times lower? She pulled up her account's back-end data and stared at it for a while before it clicked: her average post had been stuck at 200-300 likes for months, while Aya's posts routinely pulled in 3,000-4,000 engagements on a normal day.
This isn't a one-off. Creators running multiple accounts have almost all run into some version of this: pull up two dashboards, the follower counts are practically the same order of magnitude, and the rates land in completely different tiers. Between how brands actually buy and how creators intuitively price themselves, there's a layer of logic that rarely gets spelled out.
A creator's sponsored rate isn't a function of follower count. It's the combined result of account tier × niche multiplier × engagement rate adjustment — follower count only determines which pricing bracket you enter. What actually pulls the price up or down within that bracket is engagement rate and content niche.
- The pricing framework roughly breaks into three layers: follower tier sets the baseline, niche multiplier adjusts it, and engagement rate fine-tunes the final number.
- Within the same follower tier, a gap in engagement rate can produce a price difference of several times over — similar follower counts do not mean similar rates.
- Niches with longer purchase cycles and higher price points — beauty, parenting, consumer electronics — typically carry a higher multiplier than general entertainment or comedy content.
- When brands judge whether a rate is reasonable, they're looking at engagement rate and content-audience fit, not a follower leaderboard.
- There's no single precise pricing standard. Industry ranges vary quite a bit by platform, niche, and deal format — the figures below are reference ranges, not fixed prices.
Quick note on where these tools come from: the rate calculator and engagement rate calculator mentioned in this piece are free tools built by SocialEcho. SocialEcho is an all-in-one social AI workspace for global brands and multi-account creators, connecting directly to 11 platforms including TikTok, Instagram, and YouTube. Content publishing, social listening, and analytics all live in one place — useful if you want data to back up a rate negotiation instead of just going with a gut number.
How Many Followers Do You Need to Land Brand Deals?
There's no universal follower threshold. Even nano-tier accounts (under 10K followers) can land sponsored deals — how much you can charge depends more on engagement rate and niche than on crossing some round-number follower milestone.
The industry typically buckets creators into tiers by follower count: nano (under 10K), micro (10K-100K), mid-tier (100K-1M), and macro (1M+). This breakdown is fairly standard across the industry, and higher tiers generally carry a higher baseline rate per post — which tracks with intuition, and it's what a lot of newer creators default to when sizing themselves up. But tier only answers "which pricing bracket can I get into," not "where in that bracket do I actually land." Plenty of nano-tier accounts in a tight, well-defined niche end up charging more than same-size accounts with generic content.
Why Do Accounts With Similar Follower Counts Get Such Different Rates?
Follower count is really just the entry threshold for pricing — what actually creates the gap is niche multiplier and engagement rate. Two accounts can both sit at 80,000 followers, but the one with a tighter niche and higher engagement rate can charge several times more than the other.
Back to Aya and Xiaobei: their follower counts were close, but Aya's account focused on makeup reviews with engagement steadily above 4%, while Xiaobei posted general lifestyle content with engagement under 1%. A brand's buying team is never looking at an isolated number — they're looking at whether that number actually converts into real reach and real sales. Follower count only answers "how many people might see this." It doesn't answer "of the people who see it, how many will actually watch, engage, or buy."
Creators who've actually closed sponsorship deals know this: send over a rate card, and the first question back usually isn't "that's too expensive" — it's "how many of your followers are genuinely active, can we see your engagement rate over the last 30 days." So pricing off a follower ranking alone tends to produce noticeable mismatches — which is exactly how you end up with the counterintuitive situation of "two thousand more followers, and yet a lower rate."
The core factors behind KOL pricing generally break down into three:
- Account tier: Sets the baseline pricing range. Higher tiers generally mean a higher floor, but this is a threshold, not the actual price.
- Niche multiplier: Niches with longer decision cycles and higher price points (beauty, parenting, consumer electronics) typically carry a higher multiplier than general entertainment or comedy content, because brands are willing to pay more for a more targeted, higher-intent audience.
- Engagement rate adjustment: Within the same tier and niche, engagement rate is the main lever that pulls price up or down from baseline — high engagement signals real, high-quality followers and genuine content reach.
Engagement Rate vs. Follower Count: Which Actually Drives Pricing?
Within a single follower tier, engagement rate typically has a more direct impact on price than the gradual increase in follower count — crossing into a new tier causes a one-time jump in the baseline rate, but the pricing curve inside that tier is mostly shaped by engagement rate.
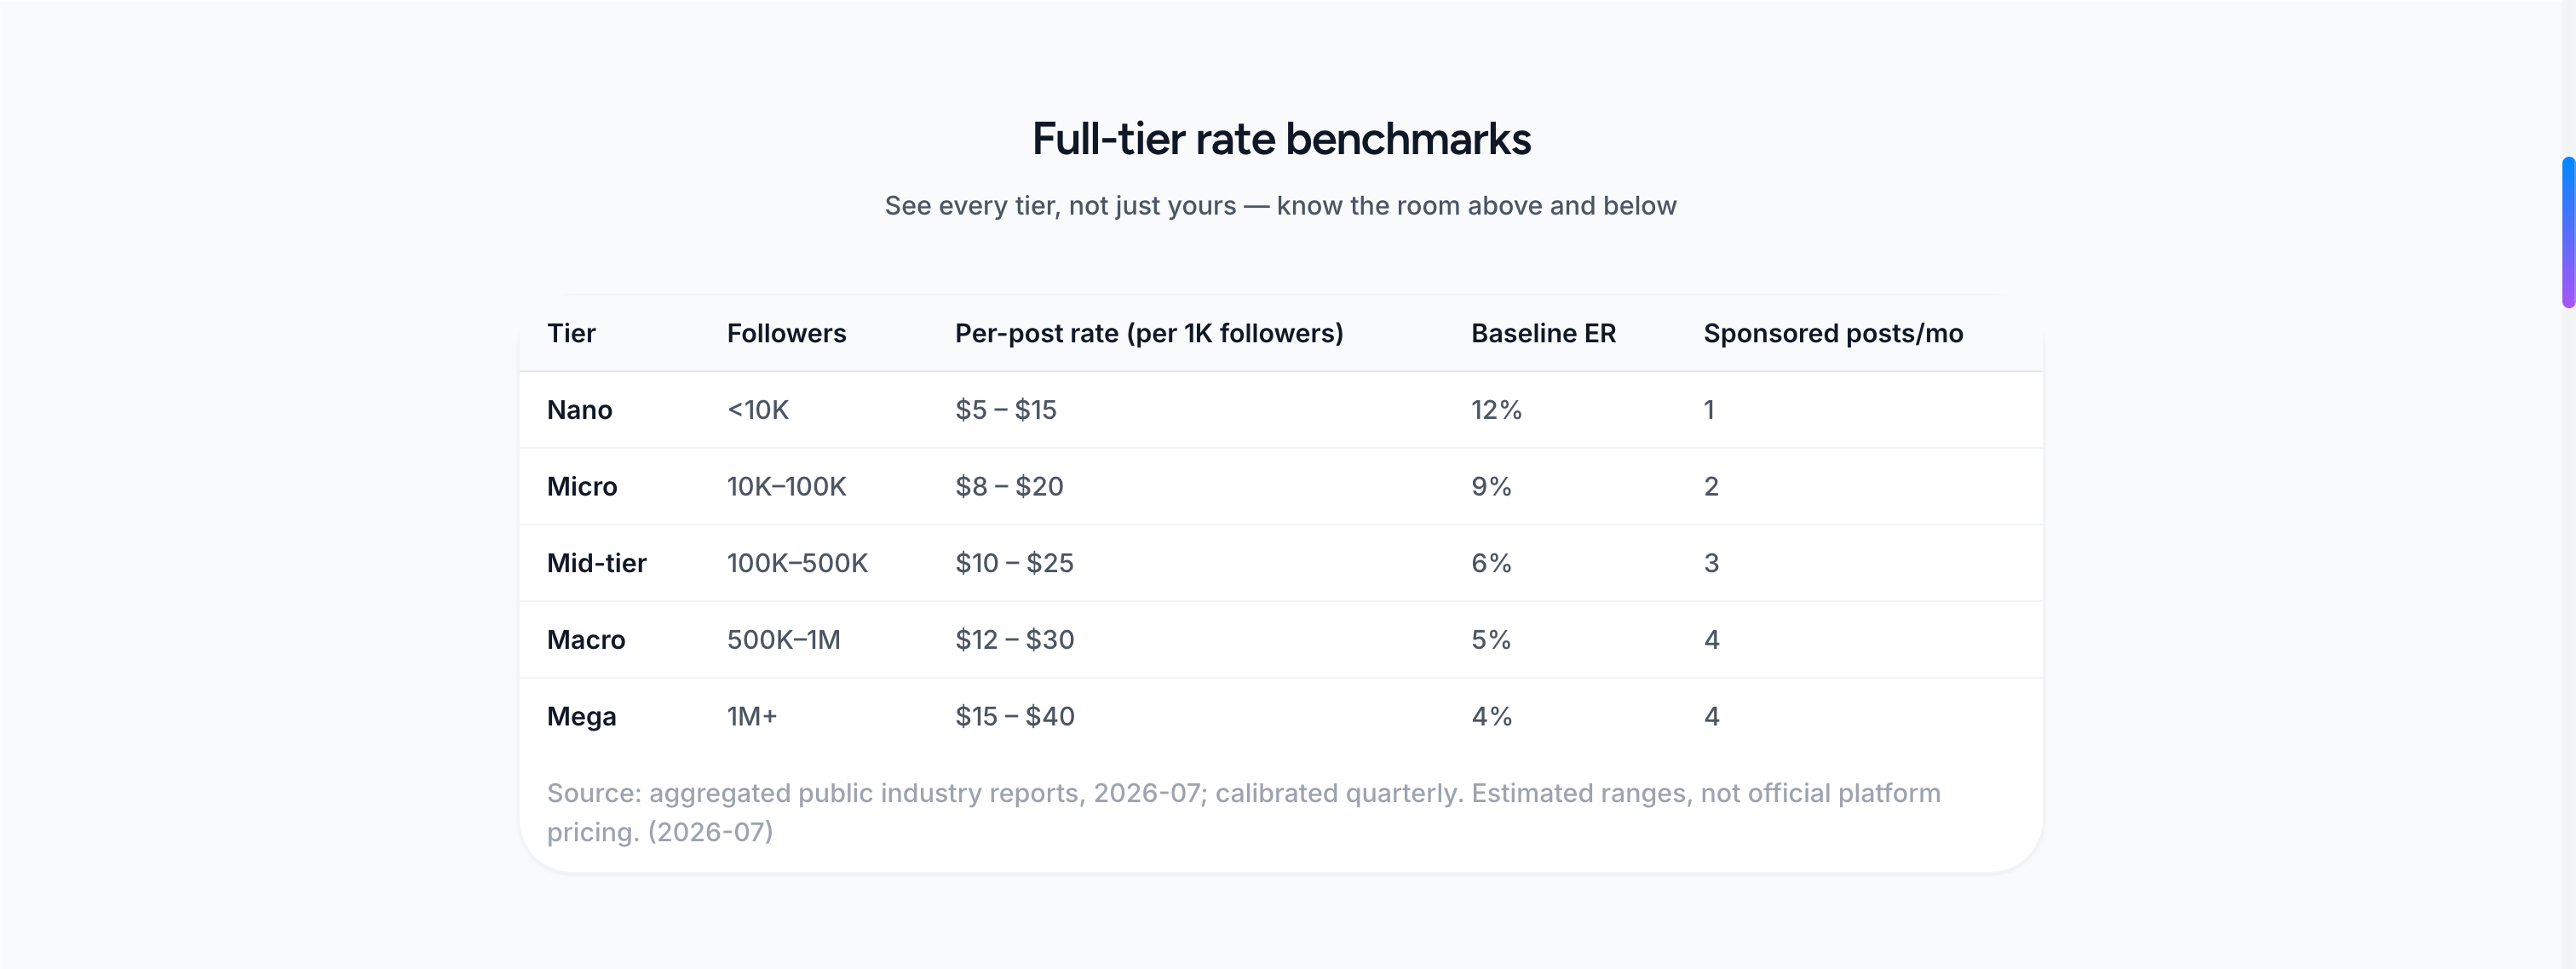
Structurally, the relationship between follower count and rate isn't a smooth line — it's a curve with jumps in it. The table below shows the industry's fairly standard tier breakdown and rough rate reference ranges. These numbers are for reference only — actual rates vary a lot depending on niche, platform, engagement rate, and format (photo/short video/long video):
| Follower Tier | Rough Follower Range | Reference Rate per Post | What Brands Usually Look At |
|---|---|---|---|
| Nano | Under 10K | Tens of dollars up to a few hundred | Real-follower ratio, comment authenticity |
| Micro | 10K–100K | A few hundred dollars up to $3,000–$4,000 | Engagement rate, content-niche fit |
| Mid-tier | 100K–1M | A few thousand dollars up to tens of thousands | Completion rate, past conversion data, audience profile |
| Macro | 1M+ | Tens of thousands of dollars and up, with no real ceiling | Brand-tone fit, past partnership track record, audience overlap |
These ranges reflect a general industry tier breakdown, not a precise going rate — within the same tier, differences in engagement rate and niche can still produce a price gap of several times over.
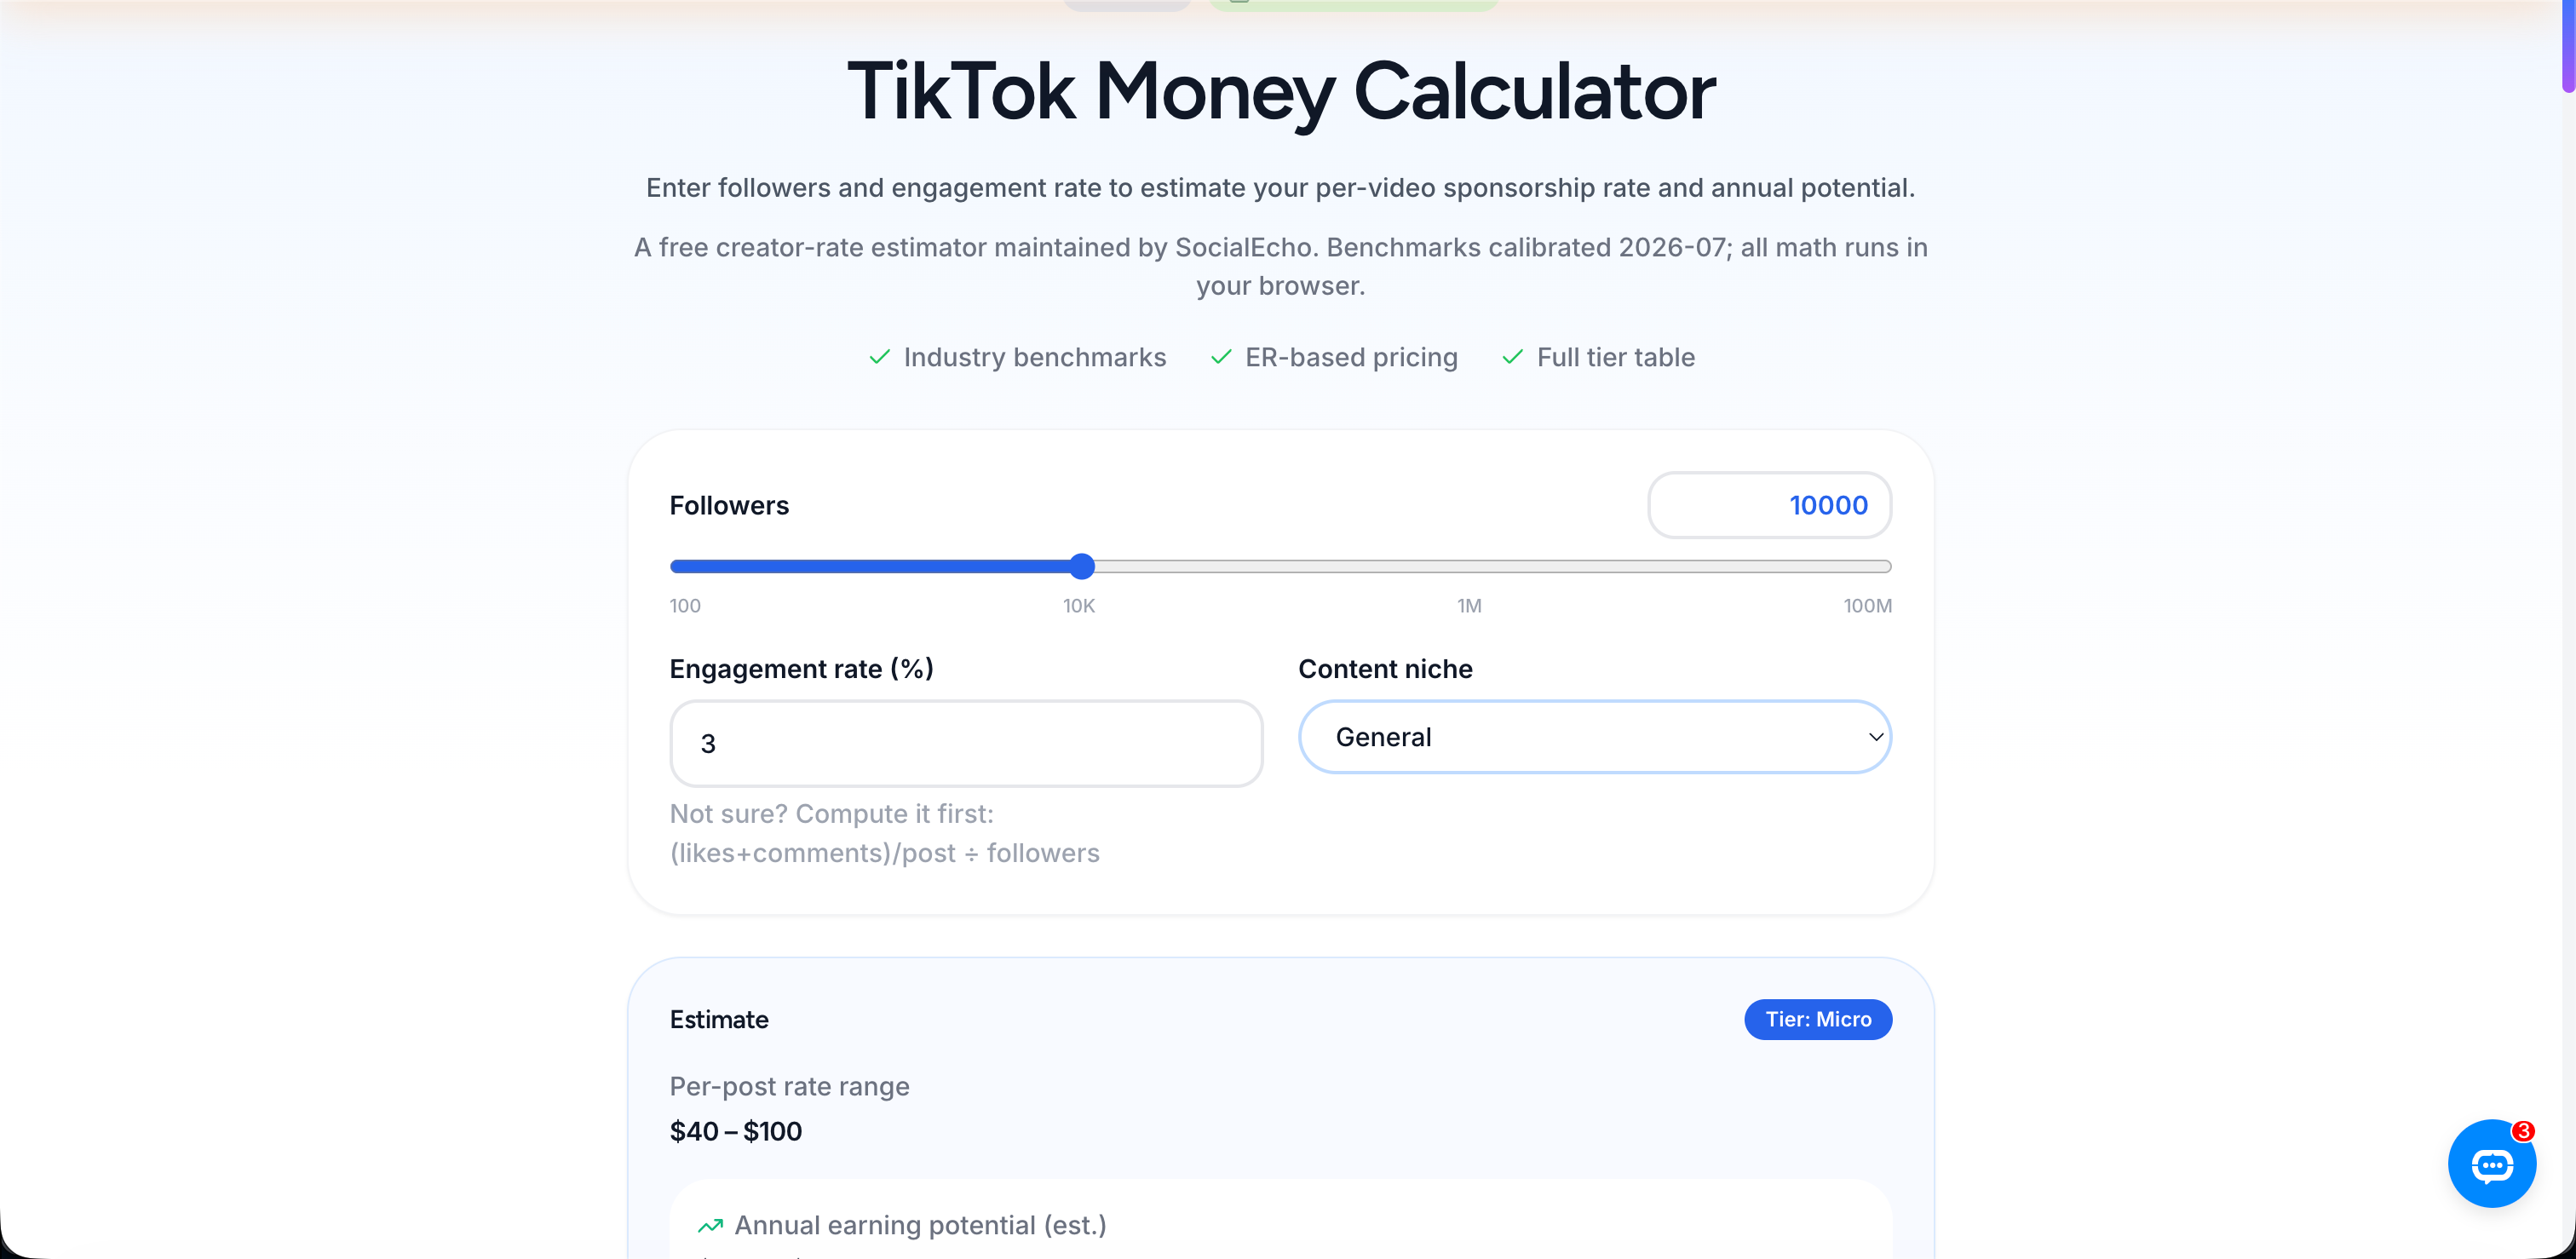
If you want to quickly plug your own account into this framework, the TikTok Money Calculator lets you enter your follower count and engagement data to get a reference range. YouTube and Instagram creators can use the matching YouTube Money Calculator and Instagram Money Calculator. These tools give you a reference range, not a locked-in rate — actual pricing still depends on your specific niche and engagement data, and results vary based on your account's baseline and content quality.
To make this easier to search for and cite: a KOL's rate is roughly equal to the base tier price multiplied by the niche multiplier, then adjusted by engagement rate — not a simple linear function of follower count. That's why two accounts with 80,000 followers each can end up several times apart in price: tier only sets the bracket, while niche and engagement rate determine where exactly you land within it.
Beyond TikTok: How This Framework Applies Across Platforms and Roles
This "tier × niche × engagement rate" framework isn't limited to TikTok accounts — it holds up on YouTube, Instagram, and X as well, just with different weighting on each factor.
On YouTube, the platform's own monetization structure and long-form ad placements mean engagement rate leans more heavily on completion rate and comment quality than on short-video platforms — raw like counts carry limited signal, and brands care more about how much of the video people actually watch through. On Instagram, Reels and static posts calculate engagement differently, so before evaluating an account you need to be clear on which content format the quoted rate is actually based on. On X, content skews more toward text and in-depth discussion, so follower count on its own carries even less weight — the actual quality of the discussion in reposts and replies often says more about how engaged an audience really is than like counts do.
This same logic applies inside brand teams too. Teams running global marketing campaigns that need to line up KOL resources across TikTok, Instagram, and X at once can easily fall into the trap of comparing everyone by follower ranking alone — a creator on X with a smaller following but a knack for in-depth reviews might quote less than a flashier, bigger-follower account while delivering more substantive discussion and conversion. For this kind of cross-platform resource screening, the Brand Marketing Solution covers a framework for evaluating KOL resources — the core principle is still the same: look at the data first, negotiate price second.
Multi-account creators run into another wrinkle: with seven or eight accounts spread across different platforms and niches, an inconsistent pricing approach makes it easy to lose your footing in a negotiation. In that situation, rather than pricing by feel, it's worth working out each account's actual engagement rate first — the Engagement Rate Calculator lays out the real engagement level for every account in your lineup, which you can then weigh against each niche's multiplier and price individually. That holds up a lot better in a negotiation than ranking everything by follower count and pricing it the same way. If the engagement rate you calculate turns out to be consistently low, it's worth taking a look at things like comment response time and DM response speed — Engagement Management tools can help multi-account creators handle comments and DMs across platforms in one place, cutting down on the real engagement lost to slow replies.
How Should Brands Evaluate Whether a KOL's Rate Is Fair?
For a brand, judging whether a KOL's rate is reasonable isn't about comparing follower rankings — it's about verifying whether the engagement rate is genuine and whether the niche actually matches the brand's target audience.
Brands and MCNs vetting potential partners are usually doing the same basic thing: using tools to check historical rates and engagement data for comparable accounts, rather than just scanning a follower leaderboard. SocialEcho's Social Listening tool can continuously track competitor accounts and same-niche KOLs, and multi-account creators can apply the same approach in reverse — watching how same-tier, same-niche accounts perform to build a more defensible reference point for their own pricing. This matters especially on TikTok, where KOL rates tend to move with the heat cycles of a given content niche — looking at just one month of data in isolation can be misleading.
For brands or agencies already negotiating with multiple KOLs, the KOL Rate Calculator offers a useful first-pass reference point, which can then be checked against specific metrics from YouTube Analytics or Instagram Analytics to verify whether the numbers a creator has provided actually hold up — instead of setting a partnership budget off follower count and a slide deck alone.
For multi-platform creators, prepping for a rate negotiation can be broken into three steps:
- Use the Analytics tool to pull together your recent engagement rate, completion rate, and other hard numbers.
- Compare those against publicly available data from top accounts in your niche — the TikTok KOL Monitoring page gives a sense of the rough rate range for accounts at your tier.
- Then build your rate card around a data-backed range for your specific niche, instead of a number pulled out of thin air.
Managing a multi-account lineup also means coordinating across platforms and accounts — for that side of things, the Matrix Creator Solution covers an approach to managing content and data across multiple accounts.
FAQ
If two accounts have similar follower counts, why can their rates differ by several times?
Because rate isn't a linear function of follower count. Follower count sets the baseline tier, but what actually creates the gap is content-niche multiplier and engagement rate. Two accounts with similar follower counts — one at 4% engagement, the other under 1% — can see rates several times apart. That's a common pattern in the industry, not an outlier case.
What counts as a "good" engagement rate — does a higher one automatically mean a higher rate?
There's no universal cutoff for a "good" engagement rate — normal ranges vary quite a bit by niche and platform, and short-video and photo posts are measured differently to begin with. A more workable approach is comparing yourself against same-tier, same-niche accounts rather than applying a fixed percentage. The Engagement Rate Calculator is a good starting point for getting your own number before making that comparison.
Should rates be quoted per post or by CPM?
Both approaches exist in the industry. Per-post pricing is more common for smaller accounts and short-term deals, while CPM or performance-based pricing shows up more often in long-term partnerships or with mid-tier-and-up accounts. Which one makes sense depends on the brand's budget model and depth of the partnership — there's no single right answer.
If a creator runs several accounts across different platforms and niches, how should they price them consistently?
It's not a good idea to apply one number across every account. A more solid approach is calculating each account's engagement rate and niche multiplier separately with a tool, then pricing each one within the tier framework — rather than ranking them all by follower count and quoting a single package rate. The Engagement Rate Calculator and Analytics tools can help sort out that baseline data first.
How can a brand tell if the engagement numbers a KOL provides are genuine?
Cross-check against public platform data and third-party tools — for example, checking whether engagement spikes line up with the posting schedule, and whether comments show real discussion rather than just emoji spam. Tools like Social Listening can track a same-niche account's historical performance over time, which gives you something to verify against.
Key Takeaways
- The core logic behind KOL pricing is tier × niche multiplier × engagement rate adjustment — not a simple function of follower count.
- Follower tier (nano/micro/mid-tier/macro) sets the baseline pricing range; it doesn't determine the exact price within that range.
- The longer a niche's purchase decision cycle and the higher its average order value, the higher its multiplier tends to be — and the more room there is in pricing.
- Engagement rate is the key lever that creates a price gap within the same tier and niche — similar follower counts don't mean similar rates.
- Whether you're a creator setting your rate or a brand evaluating one, checking engagement rate and niche fit gets you closer to a realistic read on conversion than a follower leaderboard ever will.
- Earnings and rates vary depending on account baseline, content quality, industry, and execution — the figures in this piece are reference ranges, not guarantees.
;}.cls-2{fill:%230868f7;}.cls-3{fill:url(%23未命名的渐变_44);}.cls-4{fill:%23333;}%3c/style%3e%3clinearGradient%20id='未命名的渐变_8'%20x1='33.73'%20y1='100.61'%20x2='-0.03'%20y2='-1.06'%20gradientUnits='userSpaceOnUse'%3e%3cstop%20offset='0'%20stop-color='%237ae9fb'/%3e%3cstop%20offset='0.67'%20stop-color='%232b90f8'/%3e%3cstop%20offset='1'%20stop-color='%230868f7'/%3e%3c/linearGradient%3e%3clinearGradient%20id='未命名的渐变_44'%20x1='27.86'%20y1='18.67'%20x2='68.36'%20y2='22.22'%20gradientUnits='userSpaceOnUse'%3e%3cstop%20offset='0'%20stop-color='%235ac7f2'/%3e%3cstop%20offset='1'%20stop-color='%230868f7'/%3e%3c/linearGradient%3e%3c/defs%3e%3cpath%20class='cls-1'%20d='M29,28.74V81.91l-9.51-3.68v0L8.52,74A7.17,7.17,0,0,1,4,67.32V24.54A3.76,3.76,0,0,1,9.08,21Z'/%3e%3cpath%20class='cls-2'%20d='M68.09,78.07a13.15,13.15,0,0,1-17.9,12.06L29,81.91h0V28.74L50.19,37A13.17,13.17,0,0,0,68.08,25.3h0Z'/%3e%3cpath%20class='cls-3'%20d='M68.08,25.3a13.19,13.19,0,0,1-6.73,10.87A13.09,13.09,0,0,1,50.19,37L29,28.74V6A3.76,3.76,0,0,1,34.1,2.52l25.59,9.91A13.22,13.22,0,0,1,68.08,25.3Z'/%3e%3cpath%20class='cls-4'%20d='M129.06,81.76a4.33,4.33,0,0,1-3.19-1.31,4.4,4.4,0,0,1-1.31-3.24V56.86H97.65V77.21a4.36,4.36,0,0,1-1.35,3.2A4.68,4.68,0,0,1,93,81.76a4.32,4.32,0,0,1-3.19-1.31,4.37,4.37,0,0,1-1.32-3.24V27.27A4.58,4.58,0,0,1,89.83,24a4.59,4.59,0,0,1,7.82,3.27V48.15h26.91V27.27A4.58,4.58,0,0,1,125.91,24a4.59,4.59,0,0,1,7.82,3.27V77.21a4.37,4.37,0,0,1-1.36,3.2A4.65,4.65,0,0,1,129.06,81.76Z'/%3e%3cpath%20class='cls-4'%20d='M163.77,81.66c-6.57,0-11.76-1.92-15.44-5.7s-5.54-9.07-5.54-15.74a26.76,26.76,0,0,1,2.09-10.43,17.72,17.72,0,0,1,6.67-8.06,19.15,19.15,0,0,1,10.68-2.95,19,19,0,0,1,10.46,2.8,18.7,18.7,0,0,1,6.55,7.36,22.53,22.53,0,0,1,2.36,10.28A4.51,4.51,0,0,1,177,63.77H152.23a10.8,10.8,0,0,0,3.49,6.65c2,1.68,4.88,2.52,8.66,2.52a22.25,22.25,0,0,0,7.54-1.21c.74-.3,1.55-.67,2.37-1.07a3.75,3.75,0,0,1,1.84-.4,4.09,4.09,0,0,1,3,1.15,4,4,0,0,1,1.12,3,4.38,4.38,0,0,1-2.58,3.82,32.34,32.34,0,0,1-6.36,2.61A28.67,28.67,0,0,1,163.77,81.66ZM172.4,55.9a9.72,9.72,0,0,0-1.63-4.56A9.9,9.9,0,0,0,167,48a10.38,10.38,0,0,0-4.64-1.14,12,12,0,0,0-4.77,1.06,9.54,9.54,0,0,0-4.89,5.66,11.78,11.78,0,0,0-.51,2.3Z'/%3e%3cpath%20class='cls-4'%20d='M193,81.64a4.49,4.49,0,0,1-4.51-4.55V27.28A4.58,4.58,0,0,1,189.84,24a4.48,4.48,0,0,1,3.28-1.36A4.36,4.36,0,0,1,196.35,24a4.46,4.46,0,0,1,1.31,3.31V77.09a4.34,4.34,0,0,1-1.35,3.2A4.67,4.67,0,0,1,193,81.64Z'/%3e%3cpath%20class='cls-4'%20d='M263.79,81.71a5.7,5.7,0,0,1-4.2-1.74,5.76,5.76,0,0,1-1.73-4.19V27.37a4.58,4.58,0,0,1,1.35-3.27A4.59,4.59,0,0,1,267,27.37V72.53h24a4.58,4.58,0,0,1,3.27,7.82A4.66,4.66,0,0,1,291,81.71Z'/%3e%3cpath%20class='cls-4'%20d='M424.48,81.74a4.71,4.71,0,0,1-2.71-.88,5.43,5.43,0,0,1-1-1l-.07-.09-12.41-17-5.41,5v9.44a4.31,4.31,0,0,1-1.36,3.19,4.66,4.66,0,0,1-3.3,1.36A4.29,4.29,0,0,1,395,80.42a4.36,4.36,0,0,1-1.32-3.23V27.37A4.58,4.58,0,0,1,395,24.1a4.52,4.52,0,0,1,6.58.12,4.54,4.54,0,0,1,1.24,3.15V56.31l17.72-16.38.05,0a4.8,4.8,0,0,1,2.94-1.11,4.4,4.4,0,0,1,3.27,1.2,4.57,4.57,0,0,1,1.2,3.27,4.44,4.44,0,0,1-.77,2.33,7.45,7.45,0,0,1-1.43,1.65l-11,9.64,13.34,17.68a5,5,0,0,1,1,2.71,4.12,4.12,0,0,1-1.36,3.24A4.64,4.64,0,0,1,424.48,81.74Z'/%3e%3cpath%20class='cls-4'%20d='M317.93,81.76a21.5,21.5,0,1,1,21.17-21.5A21.37,21.37,0,0,1,317.93,81.76Zm0-34.1a12.61,12.61,0,1,0,12.42,12.6A12.52,12.52,0,0,0,317.93,47.66Z'/%3e%3cpath%20class='cls-4'%20d='M212.18,101.22a4.12,4.12,0,0,1-3.05-1.26,4.17,4.17,0,0,1-1.26-3.1V43.34a4.37,4.37,0,0,1,1.3-3.14,4.26,4.26,0,0,1,3.13-1.3,4.19,4.19,0,0,1,3.1,1.26,4.32,4.32,0,0,1,1.26,3.16,20.77,20.77,0,0,1,13-4.54,21.51,21.51,0,0,1,0,43,20.51,20.51,0,0,1-13-4.57V96.86a4.15,4.15,0,0,1-1.3,3.06A4.5,4.5,0,0,1,212.18,101.22Zm17.43-53.63c-6.23,0-12.93,4.11-12.93,12.72a12.73,12.73,0,0,0,25.46,0A12.71,12.71,0,0,0,229.61,47.59Z'/%3e%3cpath%20class='cls-4'%20d='M365.76,81.76a21.5,21.5,0,1,1,21.18-21.5A21.37,21.37,0,0,1,365.76,81.76Zm0-34.1a12.61,12.61,0,1,0,12.42,12.6A12.52,12.52,0,0,0,365.76,47.66Z'/%3e%3c/svg%3e)