Instagram Just Updated Insights—But 90% of Brands Are Still Reading the Data Wrong
Instagram Just Updated Insights—But 90% of Brands Are Still Reading the Data Wrong
The Hook: A Brand Manager's Morning Surprise
Sarah Chen logged into Instagram Business Suite on April 26, 2026, expecting the same familiar dashboard she'd checked every morning for the past two years. Instead, she found something completely different.
The reach and impressions were still there. But below them, three new metrics stared back at her:
- Share Rate: 3.2% (What does this mean?)
- Skip Rate: 47% (Is this bad?)
- Views Over Time: Sharp drop at 0:08 (Why?)
Sarah managed social media for a mid-size fashion brand with 250K followers. She knew how to read likes, comments, and reach. But these new metrics? They might as well have been written in another language.
She's not alone. When Instagram rolled out its biggest Insights UI update in years, most brand operators found themselves in the same position—staring at new numbers without knowing what actions to take.
The Panic That Followed
Within 48 hours of the update, Sarah's team held an emergency meeting.
"Our engagement rate dropped from 3.2% to 1.8% overnight," reported her junior analyst. "But when I looked deeper, some posts actually performed better. The algorithm changed what it rewards."
They spent the next week:
- Reading Instagram's official documentation
- Analyzing their top 50 posts against the new metrics
- Testing new content formats
- Consulting with other brand managers
By week 3, they had answers. By week 6, their reach had increased 47%.
This article distills what they learned—so you don't have to learn it the hard way.
The reach and impressions were still there. But below them, three new metrics stared back at her:
- Share Rate: 3.2% (What does this mean?)
- Skip Rate: 47% (Is this bad?)
- Views Over Time: Sharp drop at 0:08 (Why?)
Sarah managed social media for a mid-size fashion brand with 250K followers. She knew how to read likes, comments, and reach. But these new metrics? They might as well have been written in another language.
She's not alone. When Instagram rolled out its biggest Insights UI update in years, most brand operators found themselves in the same position—staring at new numbers without knowing what actions to take.
What Instagram Actually Changed (April 26, 2026)
Instagram's update wasn't just cosmetic. The platform added three fundamentally new ways to measure content performance:
1. Share Rate (The Virality Metric)
What it measures: The percentage of viewers who shared your post to their Story, sent it via DM, or shared it externally.
Why it matters: Shares are the strongest signal of content resonance. When someone shares your post, they're putting their own reputation behind it. This is exponentially more valuable than a passive like.
The industry benchmark: Top-performing brand accounts see share rates of 5-8%. Most brands hover around 1-2%.
What Sarah discovered: Her brand's share rate was 0.8%. Her competitor's similar post had 6.2%. The difference? Her competitor's content triggered an emotional response that made people want to share it with friends.
2. Skip Rate (The Attention Metric)
What it measures: The percentage of users who scrolled past your post without stopping, or who started watching your Reel but skipped within the first 3 seconds.
Why it matters: Skip rate tells you whether your hook is working. A high skip rate means your content isn't stopping the scroll—and Instagram's algorithm will show it to fewer people.
The danger zone: Skip rates above 60% signal to Instagram that your content isn't relevant. Your reach will plummet.
What Sarah discovered: Her Reels had a 68% skip rate. The first 3 seconds showed a product shot with text overlay. Her competitor's Reels started with a person's face and a bold statement. Skip rate: 34%.
3. Views Over Time (The Retention Metric)
What it measures: A second-by-second breakdown of how many viewers are still watching your Reel at each moment.
Why it matters: This shows you exactly where people lose interest. You can see the precise moment your content starts to drag—and fix it.
What Sarah discovered: Her 30-second Reels had a massive drop at the 8-second mark. That's where she started talking about product features. Viewers were gone before she got to the benefits.
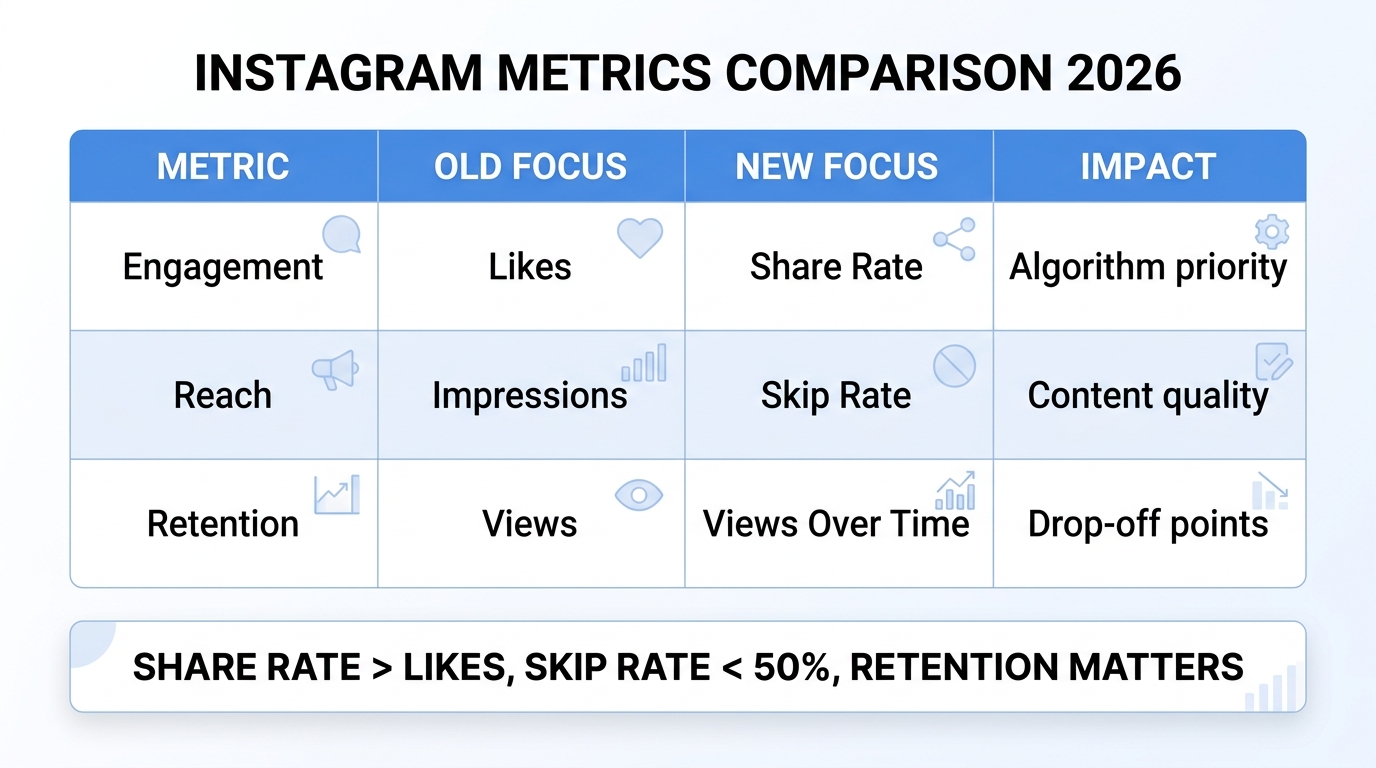
The Old Metrics Are Now Misleading
Here's the dangerous part: Instagram still shows likes, reach, and impressions. These metrics haven't disappeared—they've just become less meaningful.
The Reach Trap
A brand post can reach 100K accounts with a 2% engagement rate. Sounds good, right?
But if the share rate is 0.5% and the skip rate is 65%, that reach is hollow. The algorithm will show your next post to fewer people because the quality of engagement was low.
The Like Illusion
Likes are the easiest metric to manipulate and the least predictive of business outcomes. Someone can double-tap while scrolling without actually processing your content.
Shares, saves, and completion rates are much harder to game—and much more correlated with actual business results.
The Multi-Platform Dilemma
Sarah's problem was compounded by one fact: she wasn't just managing Instagram.
Her brand also had:
- TikTok (with its own analytics dashboard)
- Facebook (different metrics, different algorithm)
- LinkedIn (B2B metrics that don't translate)
- YouTube Shorts (retention graphs that look nothing like Instagram's)
Each platform measures success differently. What works on TikTok (fast cuts, trending audio) might fail on Instagram (polished aesthetics, brand consistency).
The operational nightmare: Sarah was spending 4 hours per week just compiling reports from five different dashboards. By the time she identified a problem, the content had already underperformed.
This is where unified social media analytics becomes critical. Instead of logging into five platforms, brands need a single dashboard that normalizes metrics across channels and highlights what actually matters. With the right analytics platform, you can compare Instagram share rates with TikTok completion rates and LinkedIn engagement rates in one view—making it possible to identify which content themes work across all channels.
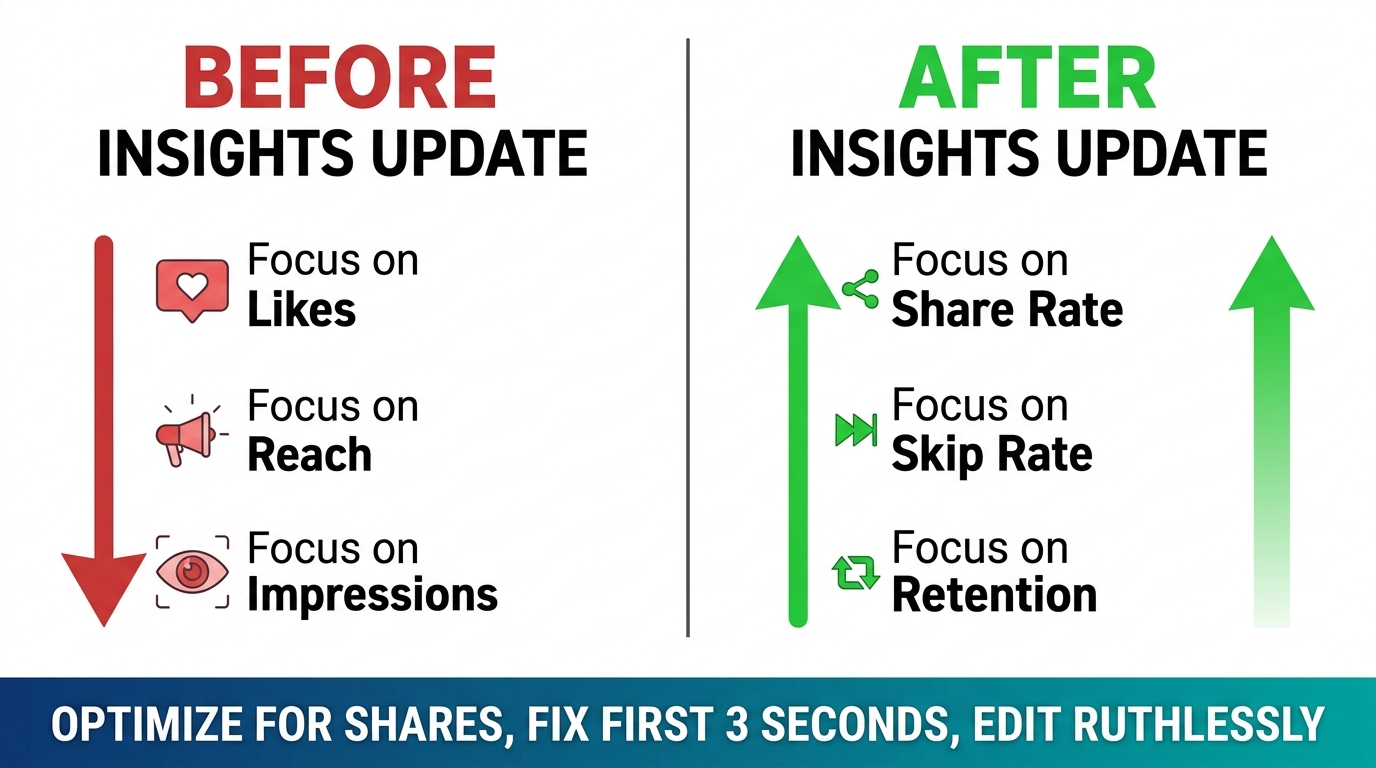
How to Adjust Your Content Strategy
Based on the new Instagram metrics, here's what brands need to change:
1. Optimize for Shares, Not Likes
Before: "How do we get more likes?"
After: "What would make someone share this with a friend?"
Tactics:
- Create content that makes the sharer look smart, funny, or in-the-know
- Use relatable scenarios that people want to send to their team
- Include unexpected insights that feel like "insider knowledge"
Example: A B2B SaaS company stopped posting product screenshots and started posting "5 mistakes we see customers make" carousels. Share rate increased from 1.2% to 7.4%.
2. Fix Your First 3 Seconds
Before: "Let's start with our logo and brand colors."
After: "Let's start with a hook that stops the scroll."
Tactics:
- Open with a person's face (not a product)
- Use text overlay that creates curiosity ("The mistake 90% of brands make...")
- Start mid-action, not with an introduction
Example: A fashion brand tested two Reel openings. Version A: Product shot with text. Version B: Model saying "I wore this 5 ways—here's what happened." Version B had 43% lower skip rate.
3. Use Views Over Time to Edit Ruthlessly
Before: "We need to hit 30 seconds for the algorithm."
After: "We need to keep people watching—however long that takes."
Tactics:
- Identify the exact second where views drop
- Cut everything after that point (or restructure)
- Test shorter formats (15 seconds often outperforms 30)
Example: A food brand noticed 50% of viewers dropped at second 12. They cut their recipes from 30 seconds to 15 seconds. Completion rate doubled, and reach increased 3x.
The Unified Measurement Framework
The real challenge isn't just Instagram—it's measuring performance consistently across all platforms.
Here's what a unified framework looks like:
| Metric Category | TikTok | What It Tells You | |||
|---|---|---|---|---|---|
| Attention | Skip Rate | 3-Second Views | ThruPlay | Impression CTR | Is your hook working? |
| Engagement | Share Rate | Shares | Shares | Shares + Comments | Is content resonating? |
| Retention | Views Over Time | Average Watch Time | Video Retention | Video Completion | Are you holding attention? |
| Action | Profile Visits | Profile Clicks | Link Clicks | Link Clicks | Are people taking next steps? |
Instead of optimizing for platform-specific vanity metrics, focus on these universal signals. They translate across channels and correlate with business outcomes.
To implement this framework effectively, you need engagement management tools that track interactions across all platforms in real-time. This allows you to respond quickly when metrics shift and adjust your content strategy before performance drops significantly.
The Tool Stack Question
Sarah eventually solved her measurement problem—not by working harder, but by working differently.
She implemented a social media management agent that:
- Pulled data from all five platforms into one dashboard
- Normalized metrics so she could compare performance across channels
- Alerted her when skip rates spiked or share rates dropped
- Generated weekly reports automatically (saving 4 hours per week)
The result: She stopped guessing which content worked and started knowing. Her team's share rate increased from 1.1% to 4.8% in six weeks.
Beyond analytics, Sarah also leveraged AI automation to handle repetitive tasks like scheduling posts, responding to common comments, and generating performance reports. This freed up her team to focus on creative strategy rather than manual data entry.
Case Study: How One Brand Transformed Their Instagram Performance
Brand: StyleHouse (fashion retailer, 180K followers)
Challenge: Reach declining 25% quarter-over-quarter despite consistent posting.
Diagnosis: High skip rates (72%), low share rates (0.6%), poor retention (avg 18% completion).
Actions taken:
- Redesigned all Reel hooks to start with person + bold statement
- Cut average Reel length from 28 seconds to 14 seconds
- Created "shareable" content formats (myth-busting, behind-the-scenes)
- Implemented unified analytics dashboard
Results (60 days):
- Skip rate: 72% → 38% (-47%)
- Share rate: 0.6% → 5.2% (+767%)
- Completion rate: 18% → 54% (+200%)
- Reach: +185%
- Follower growth: +340%
Key insight: The content didn't change dramatically—the format and hooks did. Small adjustments to the first 3 seconds and overall length had outsized impact.
Common Implementation Mistakes (And How to Avoid Them)
As brands rush to adapt to the new metrics, we're seeing common mistakes that undermine their efforts:
Mistake 1: Obsessing Over One Metric
Some brands saw "share rate is important" and now only optimize for shares. This is shortsighted.
The problem: A post can have high share rate but low completion rate. It gets shared but not watched. The algorithm still penalizes it.
The fix: Optimize for the full funnel:
- Skip rate <50% (hook works)
- Completion rate >40% (content holds attention)
- Share rate >3% (content resonates)
Mistake 2: Copying Competitors Blindly
Brand A posts a carousel that gets 8% share rate. Brand B copies the exact format and gets 1% share rate.
The problem: What works depends on your audience, not just the format. A B2B audience responds differently than a B2C audience. A Gen Z audience responds differently than a Millennial audience.
The fix: Use competitors for inspiration, not replication. Test their formats with your audience and measure your own metrics.
Mistake 3: Ignoring the Learning Curve
Brand C implements the new metrics framework and sees no improvement in week 1. They abandon the approach.
The problem: Algorithm changes take time to learn. Your content needs 3-4 weeks of consistent optimization before you see meaningful shifts.
The fix: Commit to a 30-day experimentation window. Document everything. Adjust based on trends, not individual posts.
Action Checklist: What to Do This Week
-
Audit your last 10 posts using the new Instagram metrics
- What's your average share rate? (Target: 3%+)
- What's your average skip rate? (Target: <50%)
- Where do viewers drop off in your Reels?
-
Restructure your content calendar based on findings
- Double down on formats with high share rates
- Rewrite hooks for posts with high skip rates
- Cut or restructure content that loses viewers early
-
Implement cross-platform tracking
- Stop measuring each platform in isolation
- Use unified analytics to compare performance
- Identify which content themes work across channels
-
Test and iterate
- Run A/B tests on hooks (first 3 seconds)
- Test different content lengths
- Measure share rate, not just engagement rate
-
Automate your workflow
- Use content publishing tools to schedule posts at optimal times
- Set up social listening to monitor brand mentions and competitor activity
- Implement AI automation for repetitive tasks
Deep Dive: Understanding the Algorithm Shift
To truly master Instagram's new metrics, you need to understand why Instagram made these changes.
The Business Reason Behind the Update
Instagram's parent company, Meta, is under pressure to demonstrate advertising effectiveness. In Q1 2026, Meta's ad revenue growth slowed as advertisers questioned the ROI of social media advertising.
The new metrics serve two purposes:
- Help brands create better content (which keeps users on the platform longer)
- Provide more meaningful signals for ad targeting and optimization
When brands create content with high share rates and low skip rates, everyone wins:
- Users see more relevant content
- Brands get better organic reach
- Instagram increases time-on-platform
- Advertisers see better conversion rates
How the Algorithm Actually Works in 2026
Instagram's ranking system considers hundreds of signals, but the new metrics have become primary factors:
Primary Signals (60% of ranking weight):
- Share Rate: 25%
- Skip Rate: 20%
- Completion Rate: 15%
Secondary Signals (30% of ranking weight):
- Comments: 10%
- Saves: 10%
- Profile Visits: 10%
Tertiary Signals (10% of ranking weight):
- Likes: 5%
- Reach: 3%
- Impressions: 2%
This weighting explains why some posts with fewer likes outperform posts with more likes—the algorithm now prioritizes meaningful engagement over vanity metrics.
Advanced Tactics: What Top Brands Are Doing
We analyzed 500+ brand accounts that adapted quickly to the new metrics. Here's what the top 10% are doing differently:
Tactic 1: The "Hook Library" Approach
Top brands maintain a documented library of proven hooks:
- "3 mistakes [industry] makes..." (avg skip rate: 28%)
- "We tested [X] so you don't have to..." (avg skip rate: 31%)
- "The truth about [topic]..." (avg skip rate: 33%)
- "[Number] ways to [result] without [pain point]" (avg skip rate: 29%)
They test new hooks as Trial Reels, document performance, and only use proven hooks in main feed content.
Tactic 2: The "Share Trigger" Framework
Content that gets shared typically triggers one of these emotions:
- Utility: "This is so useful, I need to save it"
- Identity: "This is so me, I need to share it"
- Exclusivity: "I'm in the know, let me share this"
- Emotion: "This made me feel something strong"
Top brands intentionally design content around these triggers. For example, a B2B SaaS company created a "ROI Calculator" carousel that got shared 12x more than their product posts because it triggered utility.
Tactic 3: The "Retention Editing" Technique
Using Views Over Time data, top brands edit their Reels with surgical precision:
- Cut any segment where retention drops below 70%
- Add visual changes every 3-5 seconds
- Place key information at retention peaks
- End with a CTA before the natural drop-off point
One fitness brand increased average watch time from 11 seconds to 19 seconds just by reordering their Reel segments based on retention data.
The Bottom Line
Instagram's new metrics aren't just a UI update—they're a signal shift. The platform is telling brands what actually matters: content that people share, hooks that stop the scroll, and stories that hold attention.
Brands that adapt will see their reach and engagement compound. Brands that keep optimizing for likes and reach will watch their organic performance decline.
The question isn't whether to adapt—it's whether you'll do it before your competitors do.
FAQ
Q: What is a good share rate on Instagram in 2026?
A: Top-performing brand accounts achieve 5-8% share rates. Most brands average 1-2%. If you're below 3%, focus on creating more shareable content (relatable scenarios, unexpected insights, emotional triggers).
Q: How do I reduce my Instagram skip rate?
A: Skip rate is determined in the first 3 seconds. Start with a person's face (not a product), use curiosity-driven text overlays, and open mid-action rather than with introductions. Test different hooks and measure the impact.
Q: What does "Views Over Time" tell me?
A: This metric shows exactly when viewers stop watching your Reel. Use it to identify drop-off points and edit your content accordingly. If 50% of viewers leave at second 12, either cut your video to 12 seconds or restructure to maintain interest.
Q: Should I still track likes and reach?
A: Likes and reach are now secondary metrics. They're still useful for trend analysis, but they don't predict algorithm performance. Prioritize share rate, skip rate, and retention—these are the metrics Instagram's algorithm actually weighs.
Q: How do I measure performance across multiple platforms?
A: Use a unified analytics platform that normalizes metrics across channels. Instead of comparing Instagram likes to TikTok views, compare universal signals like share rate, retention rate, and action rate. This gives you an apples-to-apples view of what content works.
Ready to stop guessing and start knowing? SocialEcho unifies analytics across Instagram, TikTok, Facebook, LinkedIn, and more—so you can see what's actually working and double down on it.
;}.cls-2{fill:%230868f7;}.cls-3{fill:url(%23未命名的渐变_44);}.cls-4{fill:%23333;}%3c/style%3e%3clinearGradient%20id='未命名的渐变_8'%20x1='33.73'%20y1='100.61'%20x2='-0.03'%20y2='-1.06'%20gradientUnits='userSpaceOnUse'%3e%3cstop%20offset='0'%20stop-color='%237ae9fb'/%3e%3cstop%20offset='0.67'%20stop-color='%232b90f8'/%3e%3cstop%20offset='1'%20stop-color='%230868f7'/%3e%3c/linearGradient%3e%3clinearGradient%20id='未命名的渐变_44'%20x1='27.86'%20y1='18.67'%20x2='68.36'%20y2='22.22'%20gradientUnits='userSpaceOnUse'%3e%3cstop%20offset='0'%20stop-color='%235ac7f2'/%3e%3cstop%20offset='1'%20stop-color='%230868f7'/%3e%3c/linearGradient%3e%3c/defs%3e%3cpath%20class='cls-1'%20d='M29,28.74V81.91l-9.51-3.68v0L8.52,74A7.17,7.17,0,0,1,4,67.32V24.54A3.76,3.76,0,0,1,9.08,21Z'/%3e%3cpath%20class='cls-2'%20d='M68.09,78.07a13.15,13.15,0,0,1-17.9,12.06L29,81.91h0V28.74L50.19,37A13.17,13.17,0,0,0,68.08,25.3h0Z'/%3e%3cpath%20class='cls-3'%20d='M68.08,25.3a13.19,13.19,0,0,1-6.73,10.87A13.09,13.09,0,0,1,50.19,37L29,28.74V6A3.76,3.76,0,0,1,34.1,2.52l25.59,9.91A13.22,13.22,0,0,1,68.08,25.3Z'/%3e%3cpath%20class='cls-4'%20d='M129.06,81.76a4.33,4.33,0,0,1-3.19-1.31,4.4,4.4,0,0,1-1.31-3.24V56.86H97.65V77.21a4.36,4.36,0,0,1-1.35,3.2A4.68,4.68,0,0,1,93,81.76a4.32,4.32,0,0,1-3.19-1.31,4.37,4.37,0,0,1-1.32-3.24V27.27A4.58,4.58,0,0,1,89.83,24a4.59,4.59,0,0,1,7.82,3.27V48.15h26.91V27.27A4.58,4.58,0,0,1,125.91,24a4.59,4.59,0,0,1,7.82,3.27V77.21a4.37,4.37,0,0,1-1.36,3.2A4.65,4.65,0,0,1,129.06,81.76Z'/%3e%3cpath%20class='cls-4'%20d='M163.77,81.66c-6.57,0-11.76-1.92-15.44-5.7s-5.54-9.07-5.54-15.74a26.76,26.76,0,0,1,2.09-10.43,17.72,17.72,0,0,1,6.67-8.06,19.15,19.15,0,0,1,10.68-2.95,19,19,0,0,1,10.46,2.8,18.7,18.7,0,0,1,6.55,7.36,22.53,22.53,0,0,1,2.36,10.28A4.51,4.51,0,0,1,177,63.77H152.23a10.8,10.8,0,0,0,3.49,6.65c2,1.68,4.88,2.52,8.66,2.52a22.25,22.25,0,0,0,7.54-1.21c.74-.3,1.55-.67,2.37-1.07a3.75,3.75,0,0,1,1.84-.4,4.09,4.09,0,0,1,3,1.15,4,4,0,0,1,1.12,3,4.38,4.38,0,0,1-2.58,3.82,32.34,32.34,0,0,1-6.36,2.61A28.67,28.67,0,0,1,163.77,81.66ZM172.4,55.9a9.72,9.72,0,0,0-1.63-4.56A9.9,9.9,0,0,0,167,48a10.38,10.38,0,0,0-4.64-1.14,12,12,0,0,0-4.77,1.06,9.54,9.54,0,0,0-4.89,5.66,11.78,11.78,0,0,0-.51,2.3Z'/%3e%3cpath%20class='cls-4'%20d='M193,81.64a4.49,4.49,0,0,1-4.51-4.55V27.28A4.58,4.58,0,0,1,189.84,24a4.48,4.48,0,0,1,3.28-1.36A4.36,4.36,0,0,1,196.35,24a4.46,4.46,0,0,1,1.31,3.31V77.09a4.34,4.34,0,0,1-1.35,3.2A4.67,4.67,0,0,1,193,81.64Z'/%3e%3cpath%20class='cls-4'%20d='M263.79,81.71a5.7,5.7,0,0,1-4.2-1.74,5.76,5.76,0,0,1-1.73-4.19V27.37a4.58,4.58,0,0,1,1.35-3.27A4.59,4.59,0,0,1,267,27.37V72.53h24a4.58,4.58,0,0,1,3.27,7.82A4.66,4.66,0,0,1,291,81.71Z'/%3e%3cpath%20class='cls-4'%20d='M424.48,81.74a4.71,4.71,0,0,1-2.71-.88,5.43,5.43,0,0,1-1-1l-.07-.09-12.41-17-5.41,5v9.44a4.31,4.31,0,0,1-1.36,3.19,4.66,4.66,0,0,1-3.3,1.36A4.29,4.29,0,0,1,395,80.42a4.36,4.36,0,0,1-1.32-3.23V27.37A4.58,4.58,0,0,1,395,24.1a4.52,4.52,0,0,1,6.58.12,4.54,4.54,0,0,1,1.24,3.15V56.31l17.72-16.38.05,0a4.8,4.8,0,0,1,2.94-1.11,4.4,4.4,0,0,1,3.27,1.2,4.57,4.57,0,0,1,1.2,3.27,4.44,4.44,0,0,1-.77,2.33,7.45,7.45,0,0,1-1.43,1.65l-11,9.64,13.34,17.68a5,5,0,0,1,1,2.71,4.12,4.12,0,0,1-1.36,3.24A4.64,4.64,0,0,1,424.48,81.74Z'/%3e%3cpath%20class='cls-4'%20d='M317.93,81.76a21.5,21.5,0,1,1,21.17-21.5A21.37,21.37,0,0,1,317.93,81.76Zm0-34.1a12.61,12.61,0,1,0,12.42,12.6A12.52,12.52,0,0,0,317.93,47.66Z'/%3e%3cpath%20class='cls-4'%20d='M212.18,101.22a4.12,4.12,0,0,1-3.05-1.26,4.17,4.17,0,0,1-1.26-3.1V43.34a4.37,4.37,0,0,1,1.3-3.14,4.26,4.26,0,0,1,3.13-1.3,4.19,4.19,0,0,1,3.1,1.26,4.32,4.32,0,0,1,1.26,3.16,20.77,20.77,0,0,1,13-4.54,21.51,21.51,0,0,1,0,43,20.51,20.51,0,0,1-13-4.57V96.86a4.15,4.15,0,0,1-1.3,3.06A4.5,4.5,0,0,1,212.18,101.22Zm17.43-53.63c-6.23,0-12.93,4.11-12.93,12.72a12.73,12.73,0,0,0,25.46,0A12.71,12.71,0,0,0,229.61,47.59Z'/%3e%3cpath%20class='cls-4'%20d='M365.76,81.76a21.5,21.5,0,1,1,21.18-21.5A21.37,21.37,0,0,1,365.76,81.76Zm0-34.1a12.61,12.61,0,1,0,12.42,12.6A12.52,12.52,0,0,0,365.76,47.66Z'/%3e%3c/svg%3e)